
Prepared by Florida Climate Center
The Florida State University
Tallahassee, FL

Summary:
- Average monthly temperatures in April were above normal across Florida.
- Monthly precipitation totals in April were below normal.
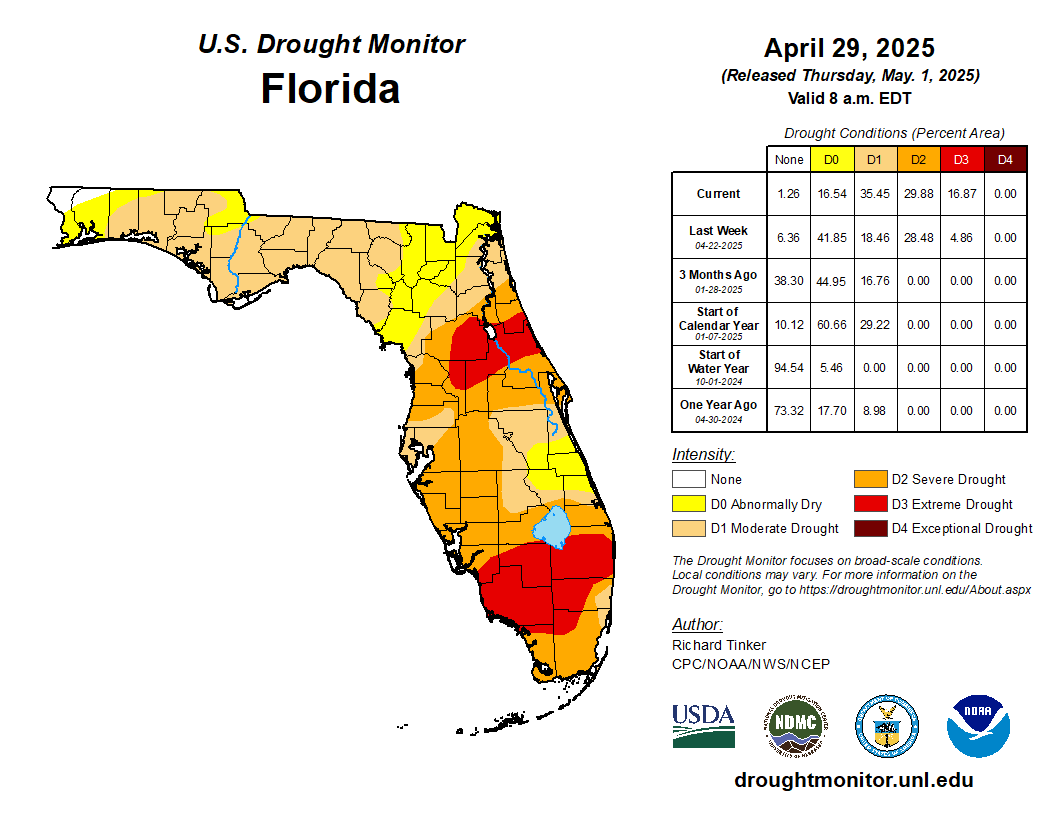
- By the end of April, approximately 17% of the state was in extreme drought (D3), 30% of the state was in severe drought (D2), 35% was in moderate drought (D1), and 17% was abnormally dry (D0), according to the U.S. Drought Monitor.
- ENSO-neutral conditions currently exist in the tropical Pacific Ocean and are expected to persist through the Northern Hemisphere summer, with a greater than 50% chance of persisting into fall (August-October 2025).
Table 1. April average temperatures and departures from normal ( ̊F) for selected cities.
| Station | Mean Temperature | Departure from Normal |
| Pensacola | 70.4 | +2.1 |
| Tallahassee | 70.8 | +3.5 |
| Jacksonville | 71.7 | +3.6 |
| Orlando | 74.9 | +2.7 |
| Tampa | 77.4 | +3.5 |
| Miami | 77.6 | +0.9 |
| Key West | 78.2 | +0.3 |
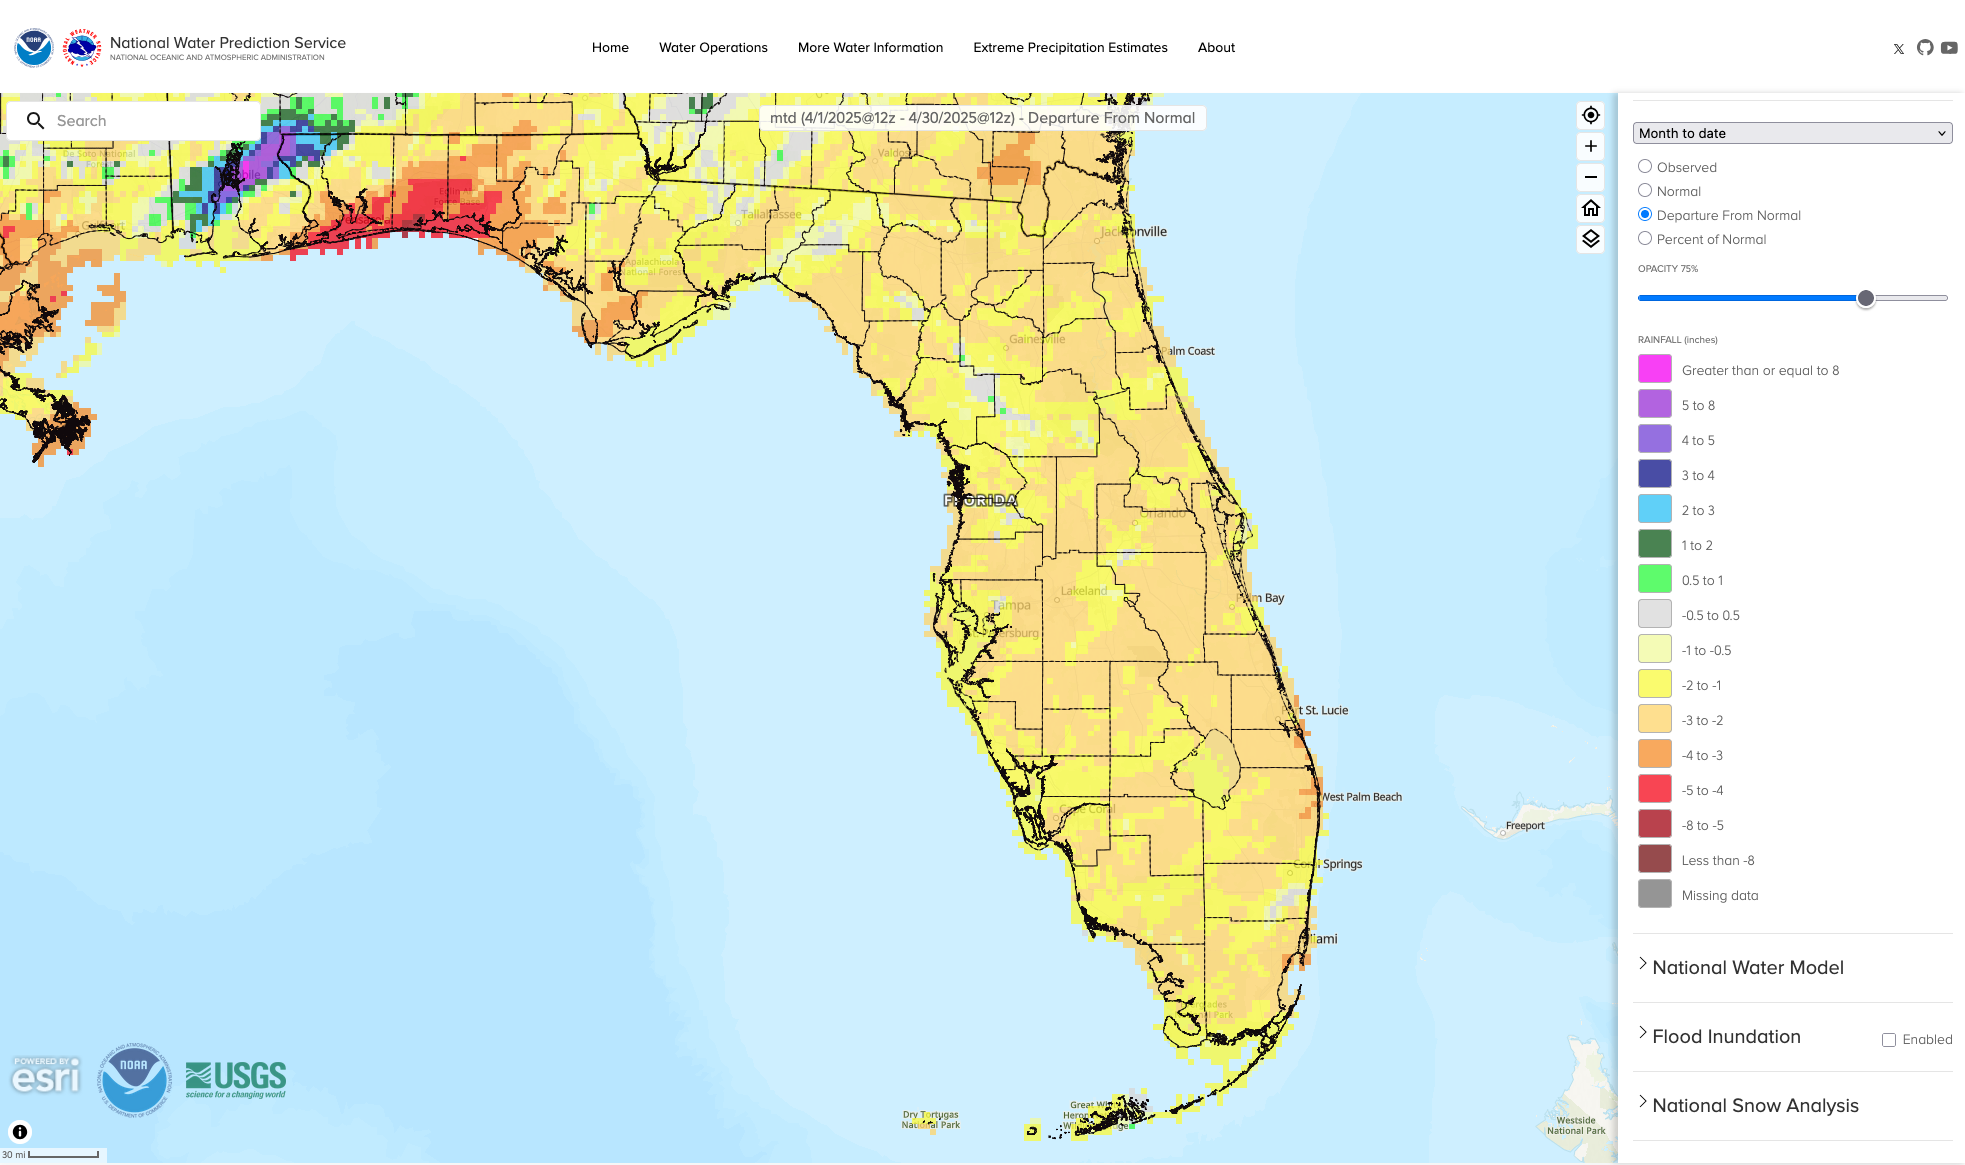
Monthly precipitation totals in April were below normal in Florida. The monthly precipitation departures from normal ranged from -4.32 inches in Pensacola to -0.77 inches in Key West (see Table 2 and Appendix 1 for select locations). Many locations in the Peninsula saw one of their top 5 driest Aprils on record, including Gainesville (3rd-driest), Daytona Beach (2nd-driest), Titusville (2nd-driest), Melbourne (2nd-driest), Venice (2nd-driest), Vero Beach (4th-driest), Naples (3rd-driest), and West Palm Beach (4th-driest). Many locations in the Peninsula have only seen a couple of inches of rain since February 1st, such as Daytona Beach and Lisbon. With below-normal rainfall and above-normal temperatures, water levels have been dropping, wildfire activity increased, the Panhandle saw increasing dryness, and severe and extreme drought expanded across the Peninsula during the month (Figure 2 below).
Table 2. April precipitation totals and departures from normal (inches) for selected cities.
| Station | Total Rainfall | Departure from Normal |
| Pensacola | 1.20 | -4.32 |
| Tallahassee | 2.48 | -1.05 |
| Jacksonville | 1.10 | -1.83 |
| Orlando | 0.37 | -2.21 |
| Tampa | 0.63 | -1.92 |
| Miami | 1.03 | -2.33 |
| Key West | 1.30 | -0.77 |
Figure 1. A graphical depiction of the monthly rainfall departure from normal (inches) for April (courtesy of NOAA, NWS).
ENSO-Neutral Conditions Present in Pacific.
NOAA issued its final La Niña Advisory on April 10, and ENSO-neutral conditions are currently present in the tropical equatorial Pacific Ocean. Over the past month, below-average sea surface temperatures weakened in the central and east-central equatorial Pacific Ocean, and the coupled ocean-atmosphere system reflected ENSO-neutral conditions. ENSO-neutral conditions are favored to continue through the Northern Hemisphere summer, with a 68% chance June-August 2025. There is a greater than 50% chance it will continue through the fall, August-October 2025.
Hazardous Weather Events in April.
According to the Local Storm Reports issued by the local National Weather Service offices serving Florida, there were 97 individual local reports of hazardous weather events recorded across the state during the month of April (see Table 3 for a breakdown by event type). Wildfires were reported in Broward and Pasco Counties, and one injury was reported as a result of the Key Vista Wildfire. The largest wildfire reported in the state was in extreme Southeast Miami-Dade County, the “344 Fire,” which burned a total of 26,719 acres and has been fully contained. Rip currents led to injuries and one fatality during the month. Numerous reports of pea-sized hail occurred during the month, and golf ball-sized hail was reported in Alachua County on the 11th.
Table 3. Breakdown of storm reports submitted in Florida during the month of April (compiled from Iowa State University/Iowa Environmental Mesonet).
| Report Type | Number of Reports |
| Heavy Rain | 1 |
| Flash Flood | 2 |
| Flood | 1 |
| Hail | 40 |
| Marine Thunderstorm Wind | 1 |
| Non-Thunderstorm Wind Gust | 3 |
| Tornado/Waterspout/Funnel Cloud | 1 / 1 / 1 |
| Thunderstorm Wind Damage | 4 |
| Non-Thunderstorm Wind Damage | 0 |
| Thunderstorm Wind Gust | 29 |
| Wildfire | 6 |
| Rip Currents | 7 |
Daily Record Events in April.
Table 4. Summary of daily records broken or set in Florida in April (source: NCEI Daily Weather Records).
| Category | Number of Records |
| Highest daily max. temp. | 61 |
| Highest daily min. temp. | 88 |
| Lowest daily max. temp. | 0 |
| Lowest daily min. temp. | 1 |
| Highest daily precipitation | 4 |
| Total | 154 |
Drought-Related Impacts.
Drought worsened in April with below-normal rainfall, decreasing water levels, and above-normal temperatures. In mid-April, roughly 2% of the state was in extreme drought (D3), 17% was in severe drought (D2), 22% of the state was in moderate drought (D1), and 18% was abnormally dry (D0), according to the U.S. Drought Monitor. By month’s end, approximately 17% of the state was in extreme drought (D3), 30% was in severe drought (D2), 35% was in moderate drought (D1), and 17% of the state was abnormally dry (D0) (Figure 2 below). Virtually all the state was in drought or pre-drought conditions by the end of the month.
As of April 30, the Lake Okeechobee water level was 11.29 ft. above sea level (Feet-NGVD29), which is below average for this time of year. At the first of the month, the water level was 12.56 ft. above sea level.
Figure 3. A graphical depiction of the latest drought conditions in Florida according to the U.S. Drought Monitor (courtesy of the National Drought Mitigation Center, University of Nebraska-Lincoln).
Agriculture-Related Impacts.
In mid-April, topsoil moisture conditions were adequate in 64% of the state, short in 29%, and very short in 5% of the state, while 2% of the state had surplus topsoil moisture conditions. By the end of April, topsoil moisture conditions were adequate in 41% of the state, short in 36%, and very short in 23% of the state; no portion of the state had surplus topsoil conditions. The entire 100cm soil profile has been drier than average across the Peninsula. For more information, consult the Crop Progress and Conditions report, which is published by the USDA’s National Agricultural Statistics Service.
Appendix 1
Additional April departures from normal data for select Florida locations (Source: NWS).
| Station | Average Temperature (˚F) | Departure from Normal (˚F) | Total Rainfall (in.) | Departure from Normal (in.) |
| Gainesville | 72.4 | +3.9 | 0.57 | -2.17 |
| Sarasota | 75.4 | +2.8 | 1.16 | -1.30 |
| Melbourne | 73.8 | +2.0 | 0.34 | -1.95 |
| Fort Myers | 76.9 | +2.1 | 0.76 | -1.68 |
| West Palm Beach | 77.1 | +2.2 | 0.21 | -3.47 |
Appendix 2
Select daily record high maximum temperatures (°F) tied or broken during April 2025 (compiled from NOAA).
| Location | Date | Record (˚F) | Broken/Tied | Last |
| Bradenton | 1 | 90 | Broken | 88 in 2023 |
| Clermont | 1 | 93 | Tied | 93 in 2021 |
| Plant City | 1 | 94 | Broken | 93 in 2021 |
| Miles City | 1 | 94 | Broken | 92 in 2006 |
| Ochopee | 1 | 93 | Broken | 89 in 2012 |
| Lakeland | 1 | 93 | Broken | 91 in 2021 |
| Clermont | 2 | 93 | Broken | 92 in 2017 |
| Fort Lauderdale | 2 | 89 | Broken | 87 in 2017 |
| Venice | 2 | 91 | Broken | 88 in 2000 |
| Gainesville | 2 | 92 | Tied | 92 in 2017 |
| Tampa | 2 | 94 | Broken | 89 in 2017 |
| Tarpon Springs | 3 | 92 | Broken | 91 in 2017 |
| Tampa | 3 | 92 | Broken | 91 in 2017 |
| Lakeland | 3 | 92 | Tied | 92 in 2017 |
| Bradenton | 4 | 91 | Broken | 89 in 2023 |
| Clermont | 4 | 94 | Tied | 94 in 2017 |
| Marianna | 4 | 89 | Broken | 87 in 2011 |
| Tampa | 4 | 93 | Broken | 88 in 2023 |
| Key West | 4 | 89 | Broken | 88 in 2022 |
| Chipley | 5 | 90 | Broken | 88 in 2023 |
| Pensacola | 6 | 81 | Broken | 79 in 1986 |
| Jacksonville | 6 | 90 | Broken | 89 in 1947 |
| Deland | 7 | 91 | Broken | 90 in 1938 |
| Lisbon | 7 | 91 | Broken | 89 in 2022 |
| Vero Beach | 7 | 91 | Broken | 90 in 2018 |
| Fort Lauderdale Beach | 8 | 88 | Broken | 87 in 2016 |
| Fort Pierce | 8 | 92 | Broken | 91 in 1939 |
| St. Augustine | 8 | 90 | Broken | 89 in 1999 |
| Tampa | 17 | 90 | Broken | 89 in 2013 |
| Lake City | 26 | 97 | Broken | 92 in 1958 |
| Crestview | 27 | 91 | Broken | 90 in 1996 |
| Tallahassee | 27 | 94 | Broken | 93 in 1989 |
| Chipley | 28 | 94 | Broken | 91 in 1989 |
| Tallahassee | 28 | 94 | Broken | 92 in 1948 |
| Chipley | 29 | 93 | Broken | 91 in 2017 |
Prepared by Florida Climate Center
Florida State University
Tallahassee, FL
Summary:
- Monthly mean temperatures in June were near to above normal in Florida.
- Monthly precipitation totals in June were mixed, with parts of the Panhandle and eastern Florida receiving above normal rainfall, while most of the Peninsula received below normal rainfall.
- Drought persisted but improved in the Panhandle and areas of exceptional drought were removed. By the end of the month, about 18% of the state was in extreme drought (D3), 41% was in severe drought (D2), 21% was in moderate drought (D1), and 13% was abnormally dry (D0), according to the U.S. Drought Monitor.
- El Niño conditions developed in the tropical equatorial Pacific Ocean and rapidly strengthened over the past few weeks. Chances for a very strong event are currently at 81% during October-December.
Monthly average temperatures in June were near to above normal for the month. Average monthly temperature departures from normal ranged from -0.5 ̊F in Pensacola to +3.1 ̊F in Sarasota for the month (see Table 1 and Appendix 1 for select cities). During June, average monthly temperatures were well above normal throughout much of the central and southern Florida Peninsula. A few locations recorded their warmest June on record, including Clermont (73 years), the Sarasota/Bradenton area (113 years), and Lakeland tied for record warmest (64 years). Several additional locations recorded one of their top five warmest Junes on record. Orlando and Hialeah had their 2nd-warmest June on record (72 years and 73 years, respectively), and the Tampa, Fort Lauderdale, and Punta Gorda areas registered their 3rd-warmest June on record (based on 137, 109, and 104 years, respectively). Select daily record high maximum temperatures tied or broken during June are provided in Appendix 2.
Table 1. June average temperatures and departures from normal ( ̊F) for select cities.
| Station | Mean Temperature | Departure from Normal |
| Pensacola | 81.2 | -0.5 |
| Tallahassee | 81.7 | +0.9 |
| Jacksonville | 81.5 | +1.2 |
| Orlando | 83.6 | +2.4 |
| Tampa | 84.8 | +1.9 |
| Miami | 84.7 | +1.9 |
| Key West | 84.9 | +0.8 |
Figure 1. Monthly average temperature departures from normal (°F) in Florida for June 2026.

Monthly precipitation totals in June were mixed, with parts of the Panhandle and eastern Florida receiving above normal rainfall, while most of the Peninsula received below normal rainfall. The monthly precipitation departures from normal ranged from -8.64 inches in Miami to +3.51 inches in Jacksonville Beach (see Table 2 and Appendix 1 for select locations). While the Florida Panhandle generally received near normal to above normal rainfall for the month, Peninsular Florida was more mixed and generally much drier. Several locations recorded one of their driest months of June on record. Locations that registered their 2nd-driest month of June on record included Fort Lauderdale (109 years), Miami (90 years), and Sarasota/Bradenton (113 years), while several other stations experienced one of their top 10 driest Junes on record (e.g., Tampa, Orlando, Lakeland, Moore Haven, Fort Myers, and Leesburg).
Table 2. June precipitation totals and departures from normal (inches) for selected cities.
| Station | Total Rainfall | Departure from Normal |
| Pensacola | 6.70 | -0.62 |
| Tallahassee | 5.20 | -2.56 |
| Jacksonville | 5.42 | -2.18 |
| Orlando | 4.12 | -3.93 |
| Tampa | 2.28 | -5.09 |
| Miami | 1.87 | -8.64 |
| Key West | 6.18 | +1.95 |
Figure 2. A graphical depiction of the monthly rainfall departure from normal (inches) for June 2026 (courtesy of NOAA, NWS).

El Niño Conditions are Present in the Pacific Ocean.
In June, El Niño conditions developed in the tropical equatorial Pacific Ocean. Over the past month, El Niño strengthened as a large area of sea surface temperature anomalies in excess of +1.0°C emerged across the central and eastern Niño index regions. The latest weekly westernmost (Niño-4) and easternmost (Niño-1+2) indices were at +0.5°C and +2.7°C, respectively. Low-level westerly wind anomalies and upper-level easterly wind anomalies were observed over the equatorial Pacific, providing reinforcing factors for a strengthening event. There is very high confidence (98% chance) that El Niño will persist through the Northern Hemisphere winter 2026-27. There is currently an 81% chance of a very strong El Niño during October-December. It is likely to rank among the strongest El Niño events in the historical record dating back to 1950.
Hazardous Weather Events in June.
According to the Local Storm Reports issued by the local National Weather Service offices serving Florida, there were 414 individual local reports of hazardous weather events recorded across the state during the month of June (see Table 3 for a breakdown by event type). Thunderstorm activity during the month led to high wind gusts, heavy downpours, and some reports of hail. On the 20th, a strong wind gust associated with a thunderstorm caused a gazebo to collapse in Hollywood in Broward County, resulting in five injuries. On the 26th, a man was injured from a lightning strike in Miami-Dade County.
Table 3. Breakdown of storm reports submitted in Florida during the month of June (compiled from Iowa State University/Iowa Environmental Mesonet).
| Report Type | Number of Reports |
| Heavy Rain | 14 |
| Flood | 5 |
| Flash Flood | 7 |
| Hail | 14 |
| Lightning | 2 |
| Marine Thunderstorm Wind | 71 |
| Non-Thunderstorm Wind Gust | 0 |
| Tornado/Waterspout/Funnel Cloud | 3 / 12 / 3 |
| Thunderstorm Wind Damage | 110 |
| Non-Thunderstorm Wind Damage | 0 |
| Thunderstorm Wind Gust | 165 |
| Wildfire | 7 |
| Rip Currents | 1 |
Daily Record Events in June.
Table 4. Summary of daily records broken, or set, in Florida in June 2026 (source: NCEI Daily Weather Records).
| Category | Number of Records |
| Highest daily max. temp. | 40 |
| Highest daily min. temp. | 70 |
| Lowest daily max. temp. | 1 |
| Lowest daily min. temp. | 12 |
| Highest daily precipitation | 12 |
| Total | 135 |
Drought-Related Impacts.
During June, drought continued to improve in some areas of the state but drought lingers in most places. By mid-June, approximately 4% of the state was in exceptional drought (D4), 20% in extreme drought (D3), 39% in severe drought (D2), and 29% was in moderate drought (D1), with about 8% abnormally dry (D0), according to the U.S. Drought Monitor. By the end of the month, no portion of the state was in exceptional drought (D4); approximately 18% of the state was in extreme drought (D3), 41% was in severe drought (D2), and 21% was in moderate drought (D1), with 13% of the state abnormally dry (D0) (Figure 3 below).
As of June 30, the Lake Okeechobee water level was 10.93 ft. above sea level (Feet-NGVD29), which is below average for this time of year and below the water shortage management level. At the first of June, the water level was 10.83 ft. above sea level.
Figure 3. A graphical depiction of the latest drought conditions in Florida according to the U.S. Drought Monitor (courtesy of the National Drought Mitigation Center, University of Nebraska-Lincoln).

Agriculture-Related Impacts.
Highly variable rainfall totals and lingering long-term drought created mixed conditions throughout the month. In mid-June, topsoil moisture conditions were adequate in 54% of the state, short in 31%, and very short in 10% of the state, while 5% had surplus topsoil moisture conditions. By the end of June, topsoil moisture conditions were adequate in 56% of the state, short in 25%, and very short in 8% of the state, while 11% of the state had surplus topsoil conditions. For more information, consult the Crop Progress and Conditions report, which are published by the USDA’s National Agricultural Statistics Service.
Appendix 1
Additional June departures from normal data for select Florida locations (source: NWS).
| Station | Average Temperature (˚F) | Departure from Normal (˚F) | Total Rainfall (in.) | Departure from Normal (in.) |
| Gainesville | 81.0 | +1.1 | 3.66 | -3.90 |
| Sarasota | 84.9 | +3.1 | 0.88 | -6.17 |
| Melbourne | 81.8 | +1.2 | 8.44 | +1.34 |
| Fort Myers | 84.3 | +2.0 | 3.80 | -5.86 |
| West Palm Beach | 84.2 | +2.5 | 4.23 | -4.25 |
Appendix 2
Select daily record high maximum temperatures tied or broken during June (compiled from NOAA).
| Station | Date | Record (˚F) | Broken/Tied | Last |
| Homestead | 1 | 96 | Broken | 95 in 2025 |
| Miami | 1 | 94 | Broken | 93 in 2019 |
| Fort Lauderdale | 2 | 96 | Broken | 92 in 2019 |
| Homestead | 2 | 97 | Broken | 94 in 2022 |
| Clermont | 3 | 97 | Broken | 96 in 2021 |
| Bradenton | 7 | 97 | Tied | 97 in 1985 |
| Tampa Bay | 8 | 97 | Broken | 96 in 2010 |
| Fort Myers | 8 | 98 | Broken | 97 in 1985 |
| Clermont | 13 | 100 | Tied | 100 in 1977 |
| Lake City | 13 | 101 | Broken | 100 in 1920 |
| Lake City | 14 | 102 | Broken | 100 in 1935 |
| Orlando | 16 | 98 | Tied | 98 in 1998 |
| Fort Lauderdale | 17 | 97 | Broken | 96 in 1958 |
| Clermont | 20 | 99 | Broken | 98 in 2022 |
| Lakeland | 21 | 98 | Broken | 97 in 1989 |
| Bradenton | 22 | 100 | Broken | 97 in 2015 |
| Miles City | 22 | 102 | Broken | 99 in 2011 |
| Lakeland | 22 | 100 | Broken | 96 in 2020 |
| Clermont | 23 | 100 | Broken | 98 in 2015 |
| Lakeland | 23 | 100 | Broken | 97 in 2020 |
| Ocala | 28 | 101 | Broken | 100 in 1900 |
| Mountain Lake | 29 | 100 | Broken | 99 in 1977 |
| Miles City | 29 | 99 | Tied | 99 in 2020 |
| Clermont | 30 | 100 | Broken | 99 in 2023 |
| Usher Tower | 30 | 97 | Broken | 96 in 1990 |
Prepared by Florida Climate Center
The Florida State University
Tallahassee, FL
Key Points:
- A warm and wet pattern emerged for much of the state in March, with above normal rainfall for the northern half of the state, alleviating drought in some locations, but the south continued to have below normal rainfall.
- An active storm pattern returned across the south and southeast U.S., which included a wildfire outbreak early in the month in the Florida Panhandle and a severe weather outbreak late in the month.
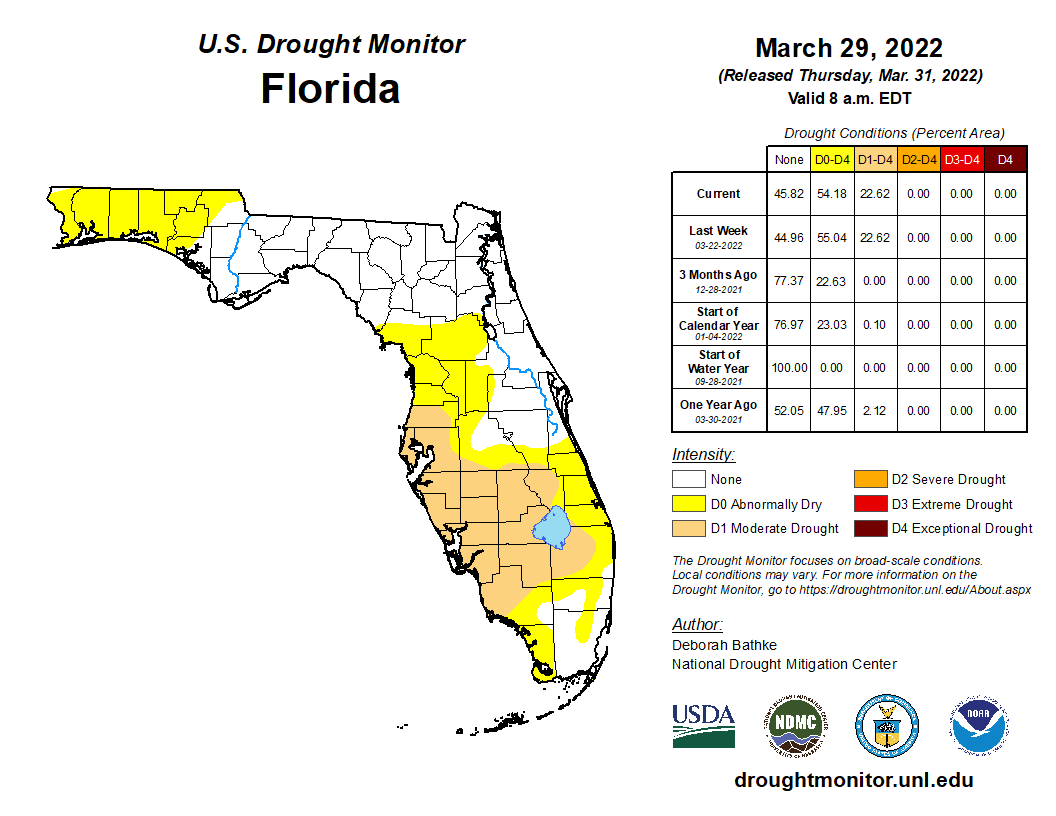
- During the first week of March, moderate drought (D1) impacted much of Florida, including the Panhandle and western Peninsula, with severe drought (D2) emerging in Dixie and Levy counties. By the end of March, drought had improved across the Panhandle and Big Bend regions as rainfall returned, but much of south Florida continues to experience moderate drought or abnormally dry conditions.
- A La Niña advisory is expected the continue through summer, but its influence may begin to wane, as the precipitation outlook through the summer calls for equal chances below, above, or near normal in Florida
Average temperatures in March were above normal across the state. Average temperature departures from normal ranged from +1.9 ̊F in Tallahassee to +5.5 ̊F in Fort Myers for the month (see Table 1 and Appendix 1 for select cities). Several stations recorded one of their top five warmest months of March on record. Fort Myers recorded its warmest March on record, while Orlando, Tampa, and Jacksonville Beach had their 3rd-warmest March on record. Several daily high maximum and high minimum temperature records were tied or broken throughout the month (see appendix 2 for daily high maximum temperature records).
Table 1. March average temperatures and departures from normal ( ̊F) for selected cities.
| Station | Mean Temperature | Departure from Normal |
| Pensacola | 65.1 | +2.8 |
| Tallahassee | 63.3 | +1.9 |
| Jacksonville | 64.5 | +2.1 |
| Orlando | 72.5 | +5.2 |
| Tampa | 73.9 | +5.3 |
| Miami | 76.2 | +3.1 |
| Key West | 76.5 | +2.1 |
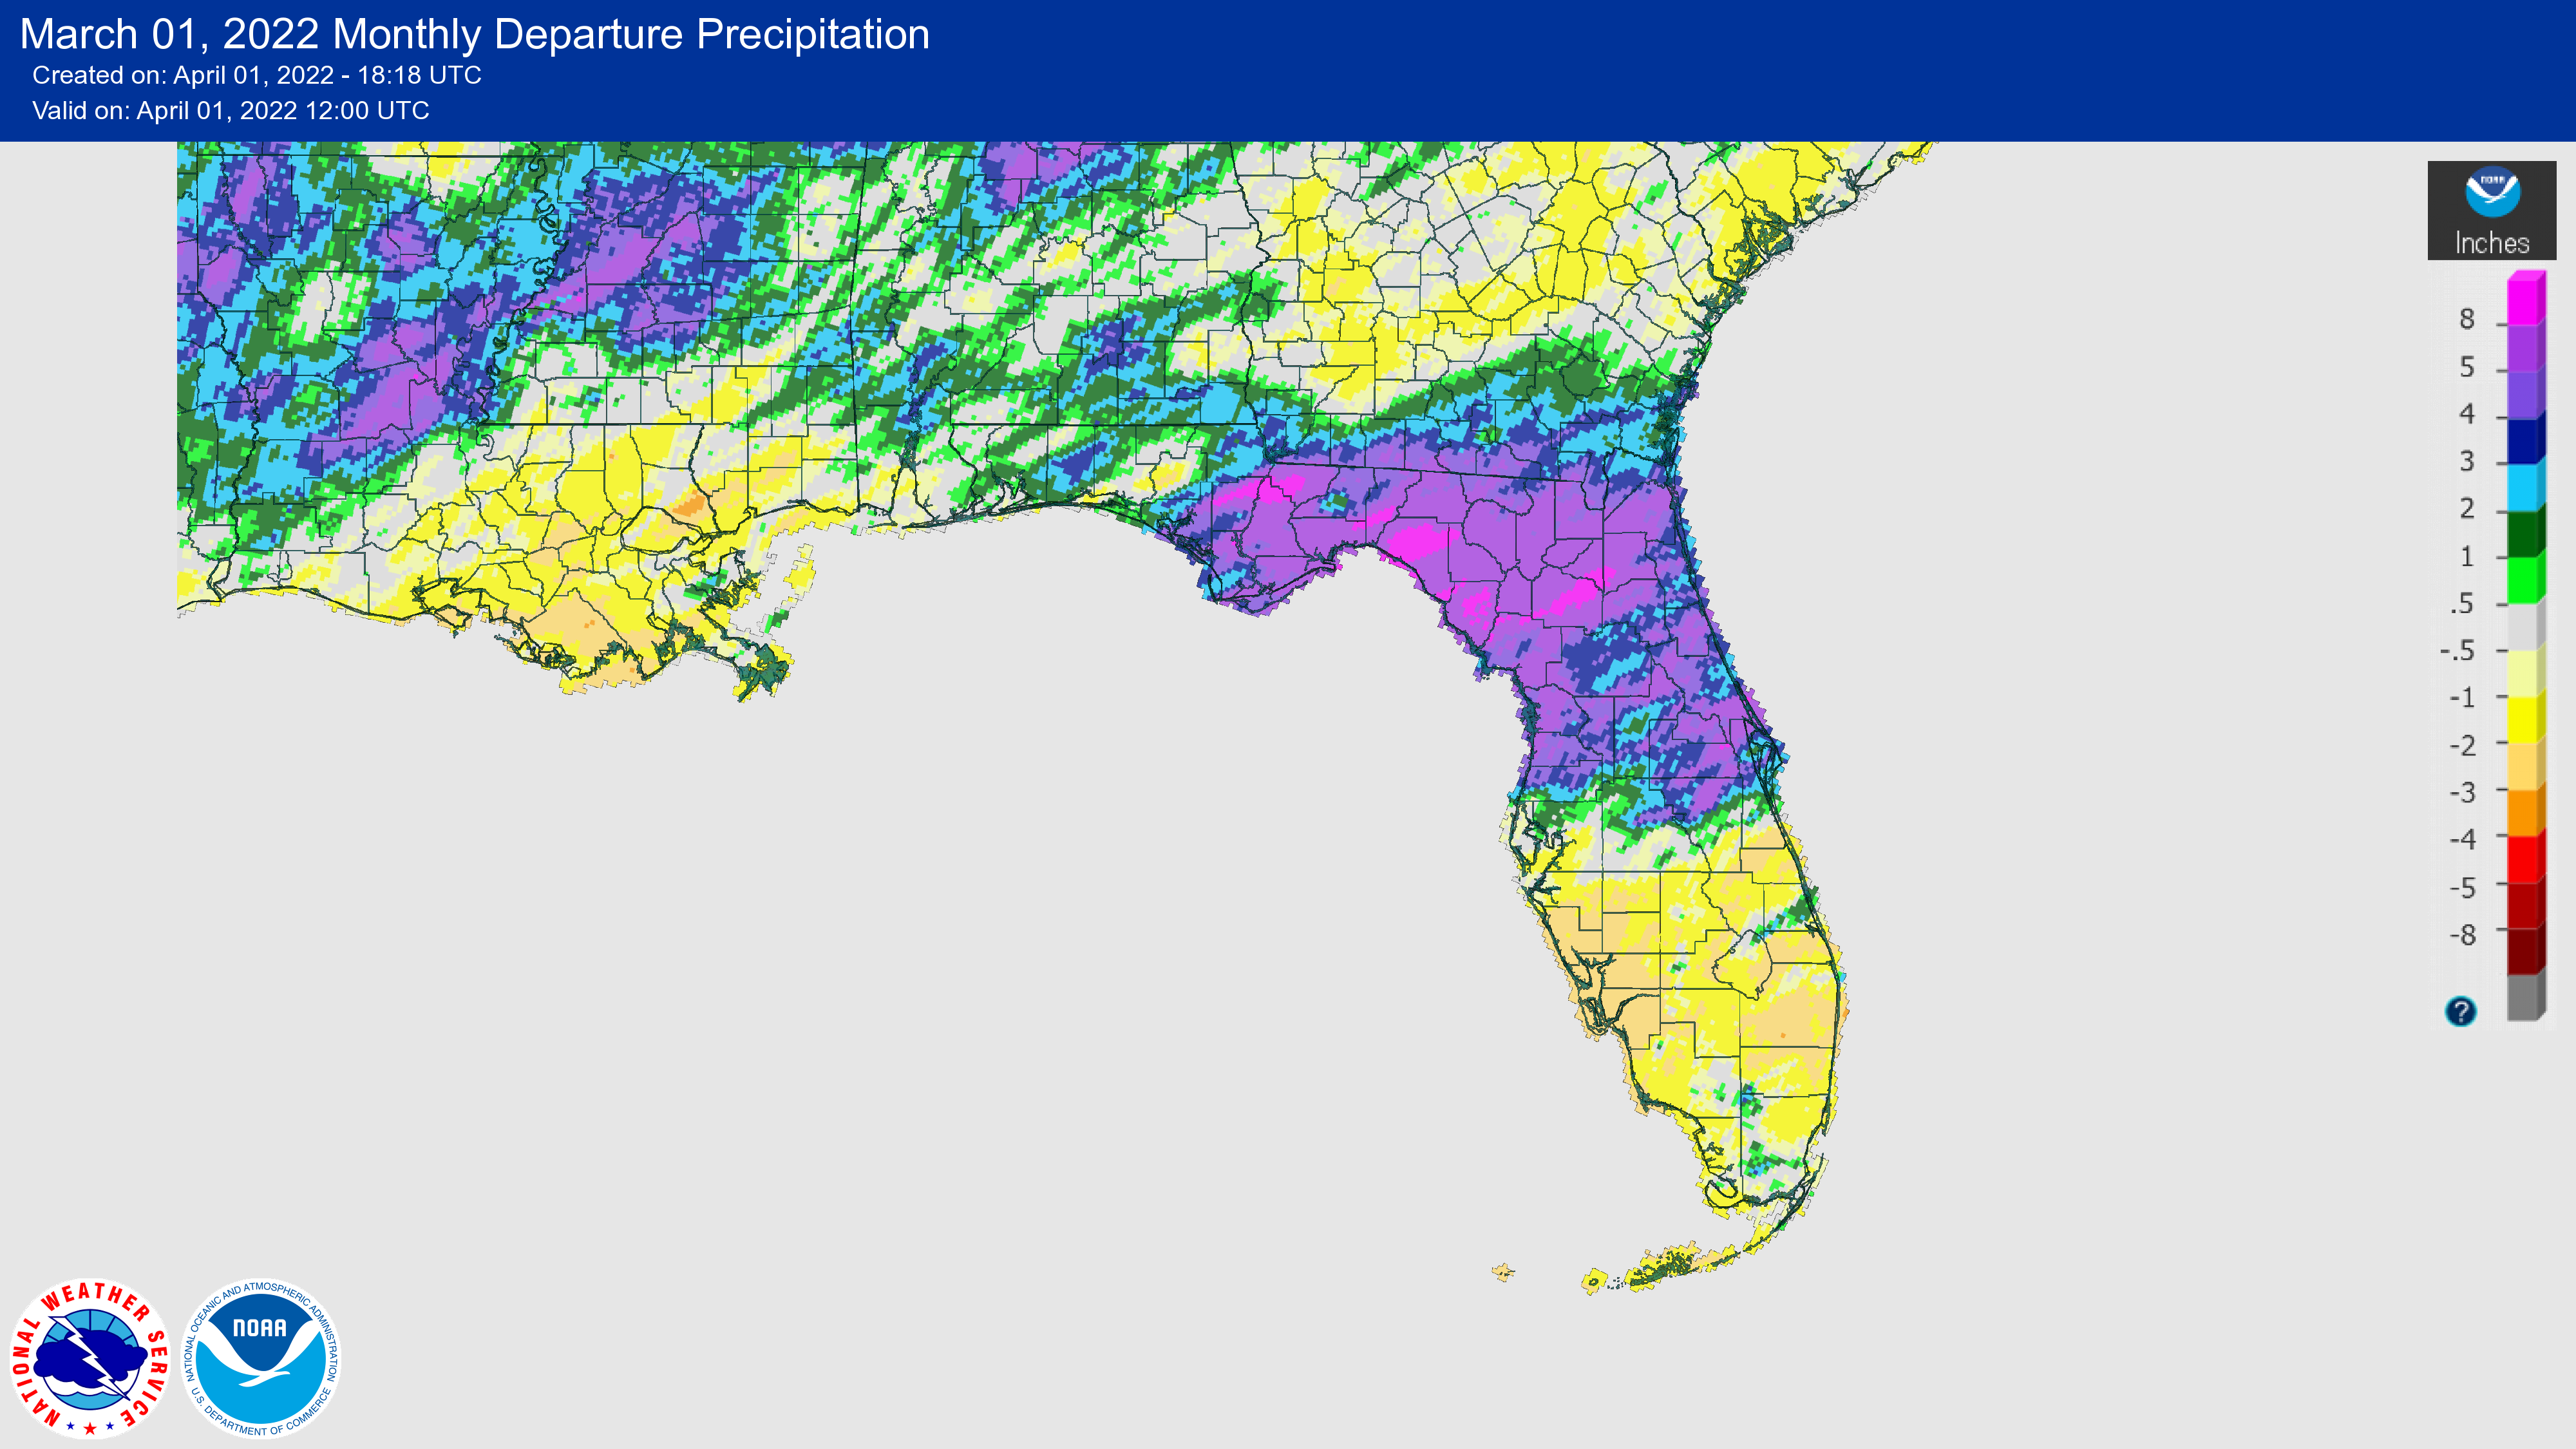
Rainfall totals in March were above normal for most places in the northern half of the state and below normal in the south. The monthly precipitation departures from normal ranged from -0.97 inches in Key West to +9.1 inches in Gainesville (Table 2 and Appendix 1). Most southerly locations in the state recorded a precipitation deficit for the month, but some places especially in north-central Florida saw a surplus of rainfall (Figure 1). Gainesville and Cross City recorded their wettest March on record, while Fort Lauderdale had its 7th-driest March on record. As a result of continued dryness, moderate drought and abnormally dry conditions continue to impact much of the southern Peninsula (see below).
Table 2. March precipitation totals and departures from normal (inches) for selected cities.
| Station | Total Rainfall | Departure from Normal |
| Pensacola | 6.09 | +0.84 |
| Tallahassee | 9.05 | +3.81 |
| Jacksonville | 9.95 | +6.66 |
| Orlando | 5.76 | +2.73 |
| Tampa | 2.91 | +0.39 |
| Miami | 2.03 | -0.43 |
| Key West | 0.56 | -0.97 |
Figure 1. A graphical depiction of the monthly rainfall departure from normal (inches) for March (courtesy of NOAA, NWS).
La Niña Advisory Continues.
La Niña, the cool phase of the ENSO climate pattern, is favored to continue into the Northern Hemisphere summer (53% chance during June-August), with a 40-50% chance of La Niña or ENSO-neutral thereafter. After weakening in January, below-average sea surface temperatures strengthened during February 2022 across the central and east-central tropical Pacific as the weekly Niño-3.4 index decreased from -0.6 ̊ C in early February to -1.1 ̊ C in the last week of February.
Hazardous Weather Events in March.
According to the Local Storm Reports issued by the local National Weather Service offices serving Florida, there were 483 individual local reports of hazardous weather events recorded across the state during the month of March 2022 (see Table 4 for a breakdown by event type). Early in the month, wildfires broke out across the Panhandle as below-normal rainfall and warm weather led to the development of abnormally dry and moderate drought conditions. Another factor contributing to this wildfire outbreak was the unusual amount of fuel on the ground as a result of Hurricane Michael nearly four years ago, which decimated forests on private land in this area. Wildfires threatened several communities and led to the evacuation of a community and nursing home in Bay County. On the 31st, a tornado in Washington County, Florida resulted in two fatalities and two injuries, part of a severe weather outbreak across 7 states that generated at least 30 tornadoes in total.
Table 4. Breakdown of storm reports submitted in Florida during the month of March (compiled from Iowa State University/Iowa Environmental Mesonet).
| Report Type | Number of Reports |
| Flash Flood | 18 |
| Heavy Rain | 29 |
| Flood | 8 |
| Hail | 38 |
| Lightning | 1 |
| Marine Thunderstorm Wind | 51 |
| Non-Thunderstorm Wind Gust | 131 |
| Non-Thunderstorm Wind Damage | 11 |
| Tornado/Waterspout/Funnel Cloud | 20/5/2 |
| Thunderstorm Wind Damage | 71 |
| Thunderstorm Wind Gust | 91 |
| Wildfire | 7 |
Drought-Related Impacts.
During the first week of March, much of Florida was experiencing drought. About 2% of the state was in severe drought (D2), 50% of the state was in moderate drought (D1), and 36% was experiencing abnormally dry conditions, according to the U.S. Drought Monitor. Conditions improved in northern Florida throughout the month as a wet pattern emerged. By the end of the month, no areas were in severe drought (D2), 23% of the state (southwestern Florida) was in moderate drought (D1), and 32% was abnormally dry.
As of March 31, the Lake Okeechobee water level was 13.78 ft. above sea level (Feet-NGVD29), which is below average for this time of the year. The water level fell below average early in the month and continued to decline. At the first of the month, the water level was around 14.52 ft. above sea level.
Agriculture-Related Impacts.
While temperatures were above normal for the month of March, a mid-month frost led to some damage to crops including to berries, watermelon, and planted corn in the northern part of the state. Pasture conditions were poor to good throughout the state due to late cool weather and frost. Cattle remained in mostly good condition due to supplemental hay feeding. Sugarcane harvest was close to completion in the southern part of the Peninsula. Strawberry harvest continued and should conclude soon. Several vegetable crops were marketed including tomatoes, peppers, eggplant, sweet corn, green beans, yellow squash, zucchini, herbs, and avocadoes. Citrus fruit harvested included white and red grapefruit, oranges, tangerines, and tangelos. For more information, consult the Crop Progress - State Stories reports, which is produced monthly December through March.
Appendix 1
Additional March departures from normal data for select Florida locations (Source: NWS).
| Station | Average Temperature (˚F) | Departure from Normal (˚F) | Total Rainfall (in.) | Departure from Normal (in.) |
| Gainesville | 66.1 | +3.4 | 12.59 | +9.10 |
| Sarasota | 71.7 | +3.6 | 2.51 | -0.34 |
| Melbourne | 71.8 | +3.2 | 5.09 | +2.40 |
| Fort Myers | 75.8 | +5.5 | 0.43 | -1.64 |
| West Palm Beach | 75.2 | +4.1 | 2.69 | -0.62 |
Appendix 2
Select daily record high maximum temperatures broken or tied during March (compiled from NOAA).
| Location | Date | Record (˚F) | Broken/Tied | Last |
| Key West | 3 | 93 | Broken | 85 in 2019 |
| Tampa | 4 | 89 | Broken | 88 in 1961 |
| Crestview | 4 | 86 | Broken | 83 in 1951 |
| Tarpon Springs | 5 | 88 | Broken | 87 in 1997 |
| Fort Myers | 5 | 90 | Tied | 90 in 1961 |
| Jacksonville Beach | 6 | 89 | Broken | 88 in 1945 |
| Live Oak | 6 | 88 | Broken | 86 in 2003 |
| Panama City | 6 | 81 | Broken | 80 in 2004 |
| Venice | 6 | 89 | Broken | 86 in 2003 |
| Tampa | 6 | 89 | Broken | 86 in 1983 |
| Key West | 6 | 87 | Broken | 84 in 2015 |
| Bradenton | 7 | 87 | Broken | 86 in 1985 |
| Cross City | 7 | 86 | Broken | 85 in 1961 |
| Usher Tower | 7 | 88 | Tied | 88 in 1974 |
| Gainesville | 7 | 87 | Broken | 86 in 1961 |
| Tampa | 7 | 88 | Broken | 86 in 1995 |
| Key West | 7 | 88 | Broken | 85 in 2008 |
| Clermont | 8 | 90 | Broken | 87 in 2003 |
| Hastings | 8 | 87 | Broken | 84 in 1996 |
| Kissimmee | 8 | 88 | Broken | 87 in 2003 |
| Orlando | 8 | 89 | Broken | 87 in 1991 |
| Key West | 8 | 89 | Broken | 88 in 1967 |
| Fort Lauderdale Beach | 9 | 85 | Broken | 84 in 2003 |
| Jacksonville Beach | 9 | 86 | Broken | 84 in 1951 |
| Gainesville | 9 | 85 | Tied | 85 in 2019 |
| Key West | 9 | 88 | Broken | 85 in 2003 |
| Daytona Beach | 10 | 85 | Broken | 83 in 1964 |
| Hastings | 10 | 85 | Broken | 83 in 2000 |
| Jacksonville Beach | 10 | 86 | Broken | 83 in 1993 |
| Perrine | 11 | 89 | Broken | 87 in 2017 |
| Plant City | 11 | 91 | Broken | 90 in 2019 |
| Key West | 11 | 89 | Broken | 86 in 2019 |
| Miami | 12 | 90 | Broken | 87 in 2014 |
| Key West | 12 | 90 | Broken | 87 in 1968 |
| Perrine | 13 | 89 | Broken | 87 in 2019 |
| Key West | 17 | 89 | Broken | 87 in 1975 |
| Bradenton | 18 | 89 | Broken | 87 in 2020 |
| Plant City | 18 | 94 | Broken | 92 in 1945 |
| Orlando | 18 | 91 | Broken | 90 in 1982 |
| Key West | 18 | 89 | Broken | 86 in 2003 |
| Lakeland | 18 | 91 | Broken | 89 in 1963 |
| Clermont | 19 | 94 | Broken | 91 in 2020 |
| Key West | 19 | 89 | Broken | 86 in 2020 |
| Ochopee | 20 | 91 | Broken | 89 in 2003 |
| Key West | 21 | 89 | Broken | 85 in 2020 |
| Venice | 22 | 88 | Broken | 87 in 2012 |
| Tampa | 22 | 88 | Broken | 86 in 2020 |
| Key West | 22 | 93 | Broken | 87 in 1977 |
| Key West | 23 | 92 | Broken | 85 in 2020 |
| Naples | 25 | 88 | Tied | 88 in 1975 |
| Fort Myers | 29 | 91 | Tied | 91 in 2020 |
| Key West | 30 | 90 | Broken | 87 in 1991 |
Prepared by Florida Climate Center
Florida State University
Tallahassee, FL
Summary:
- Monthly mean temperatures in April were above normal in Florida.
- Monthly precipitation totals in April were below normal across northern Florida, while parts of the central and southern Peninsula received above normal rainfall.
- Widespread drought persisted during the month, with some degradation in the Panhandle and north-central regions and improvements in southeastern Florida; by the end of the month, nearly 25% of the state was in exceptional drought (D4) and another 57% was in extreme drought (D3).
- ENSO-neutral conditions currently exist in the tropical equatorial Pacific Ocean with a transition to El Niño favored during May-July 2026 (61% chance).
Monthly average temperatures in April were above normal in Florida. Average monthly temperature departures from normal ranged from +0.8 ̊F in Miami to +3.2 ̊F in Sarasota for the month (see Table 1 and Appendix 1 for select cities). The Sarasota/Bradenton area registered its 4th-warmest April on record (112 years) and Lakeland had its 5th-warmest April on record (70 years). For the season to date (Mar-Apr), Florida has observed above-average temperatures statewide, and most stations are experiencing one of their top 10 warmest springs, to date, on record. The Sarasota-Bradenton area is experiencing its warmest spring on record to date (113 years). Select daily record high maximum temperatures tied or broken during April are provided in Appendix 2.
Table 1. April average temperatures and departures from normal ( ̊F) for select cities.
| Station | Mean Temperature | Departure from Normal |
| Pensacola | 70.3 | +2.0 |
| Tallahassee | 70.2 | +2.9 |
| Jacksonville | 70.7 | +2.6 |
| Orlando | 73.6 | +1.4 |
| Tampa | 75.9 | +2.0 |
| Miami | 77.5 | +0.8 |
| Key West | 79.8 | +1.9 |
Figure 1. Monthly average temperature departures from normal (°F) in Florida for April 2026.
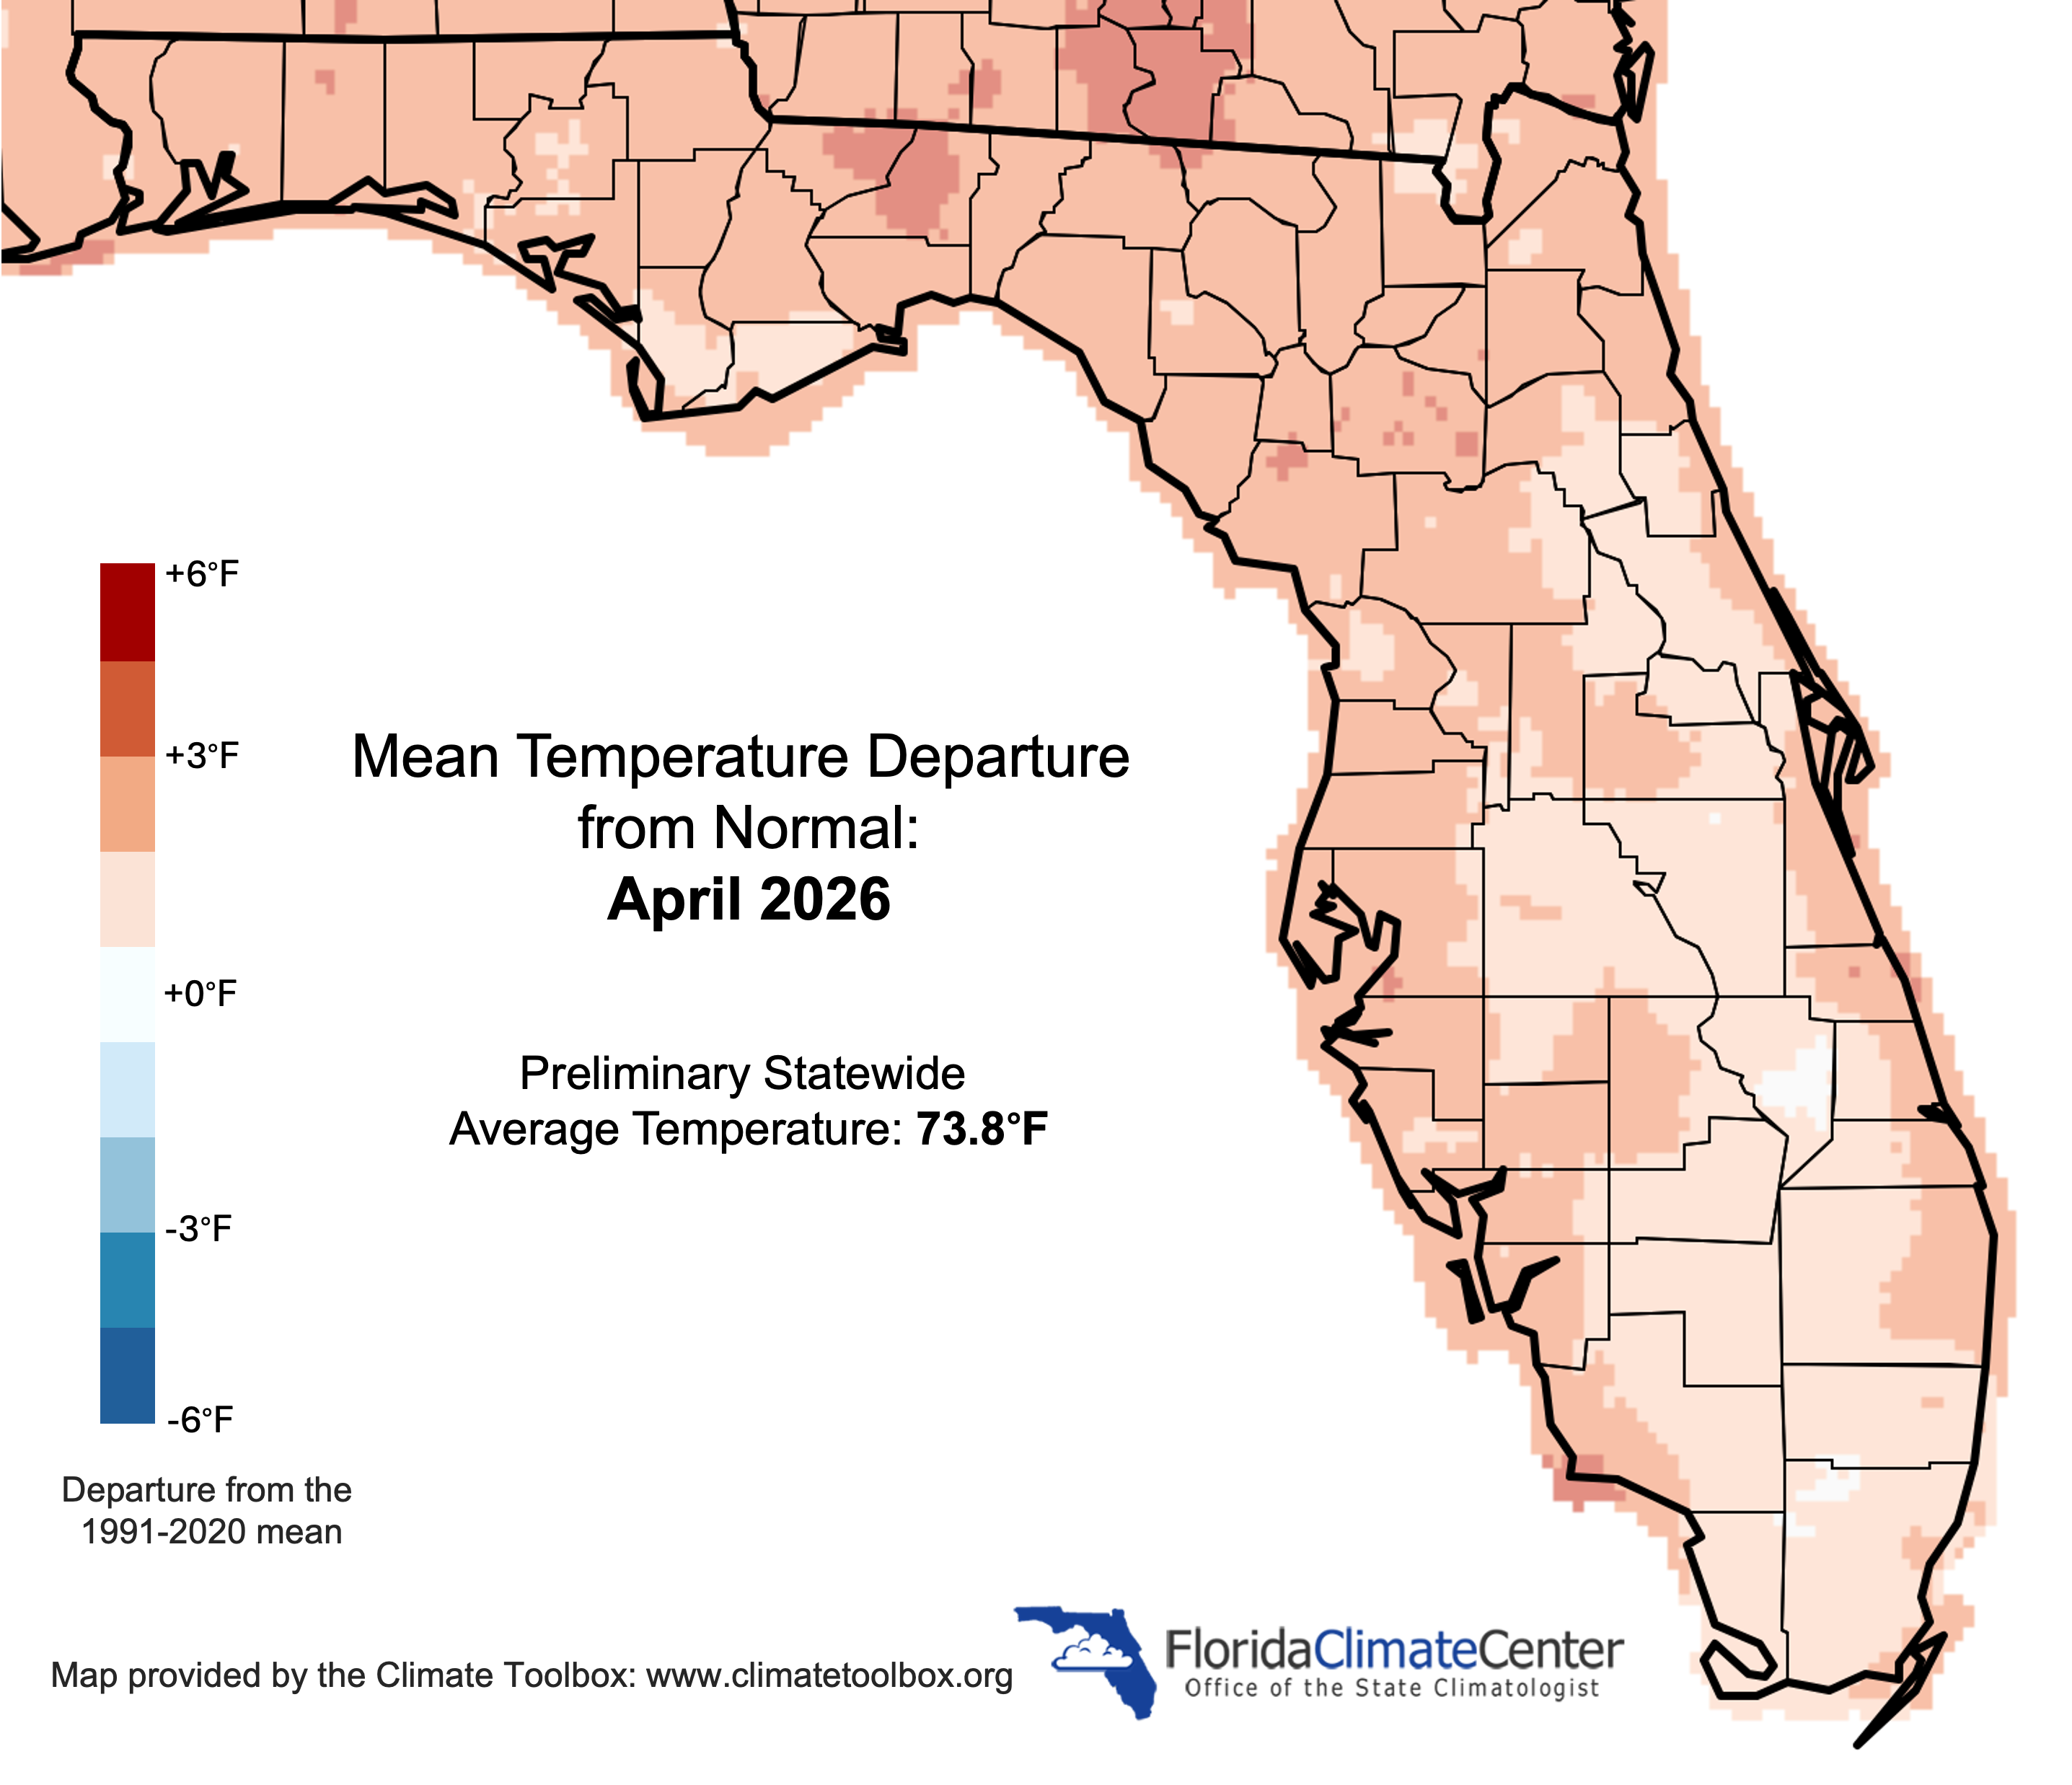
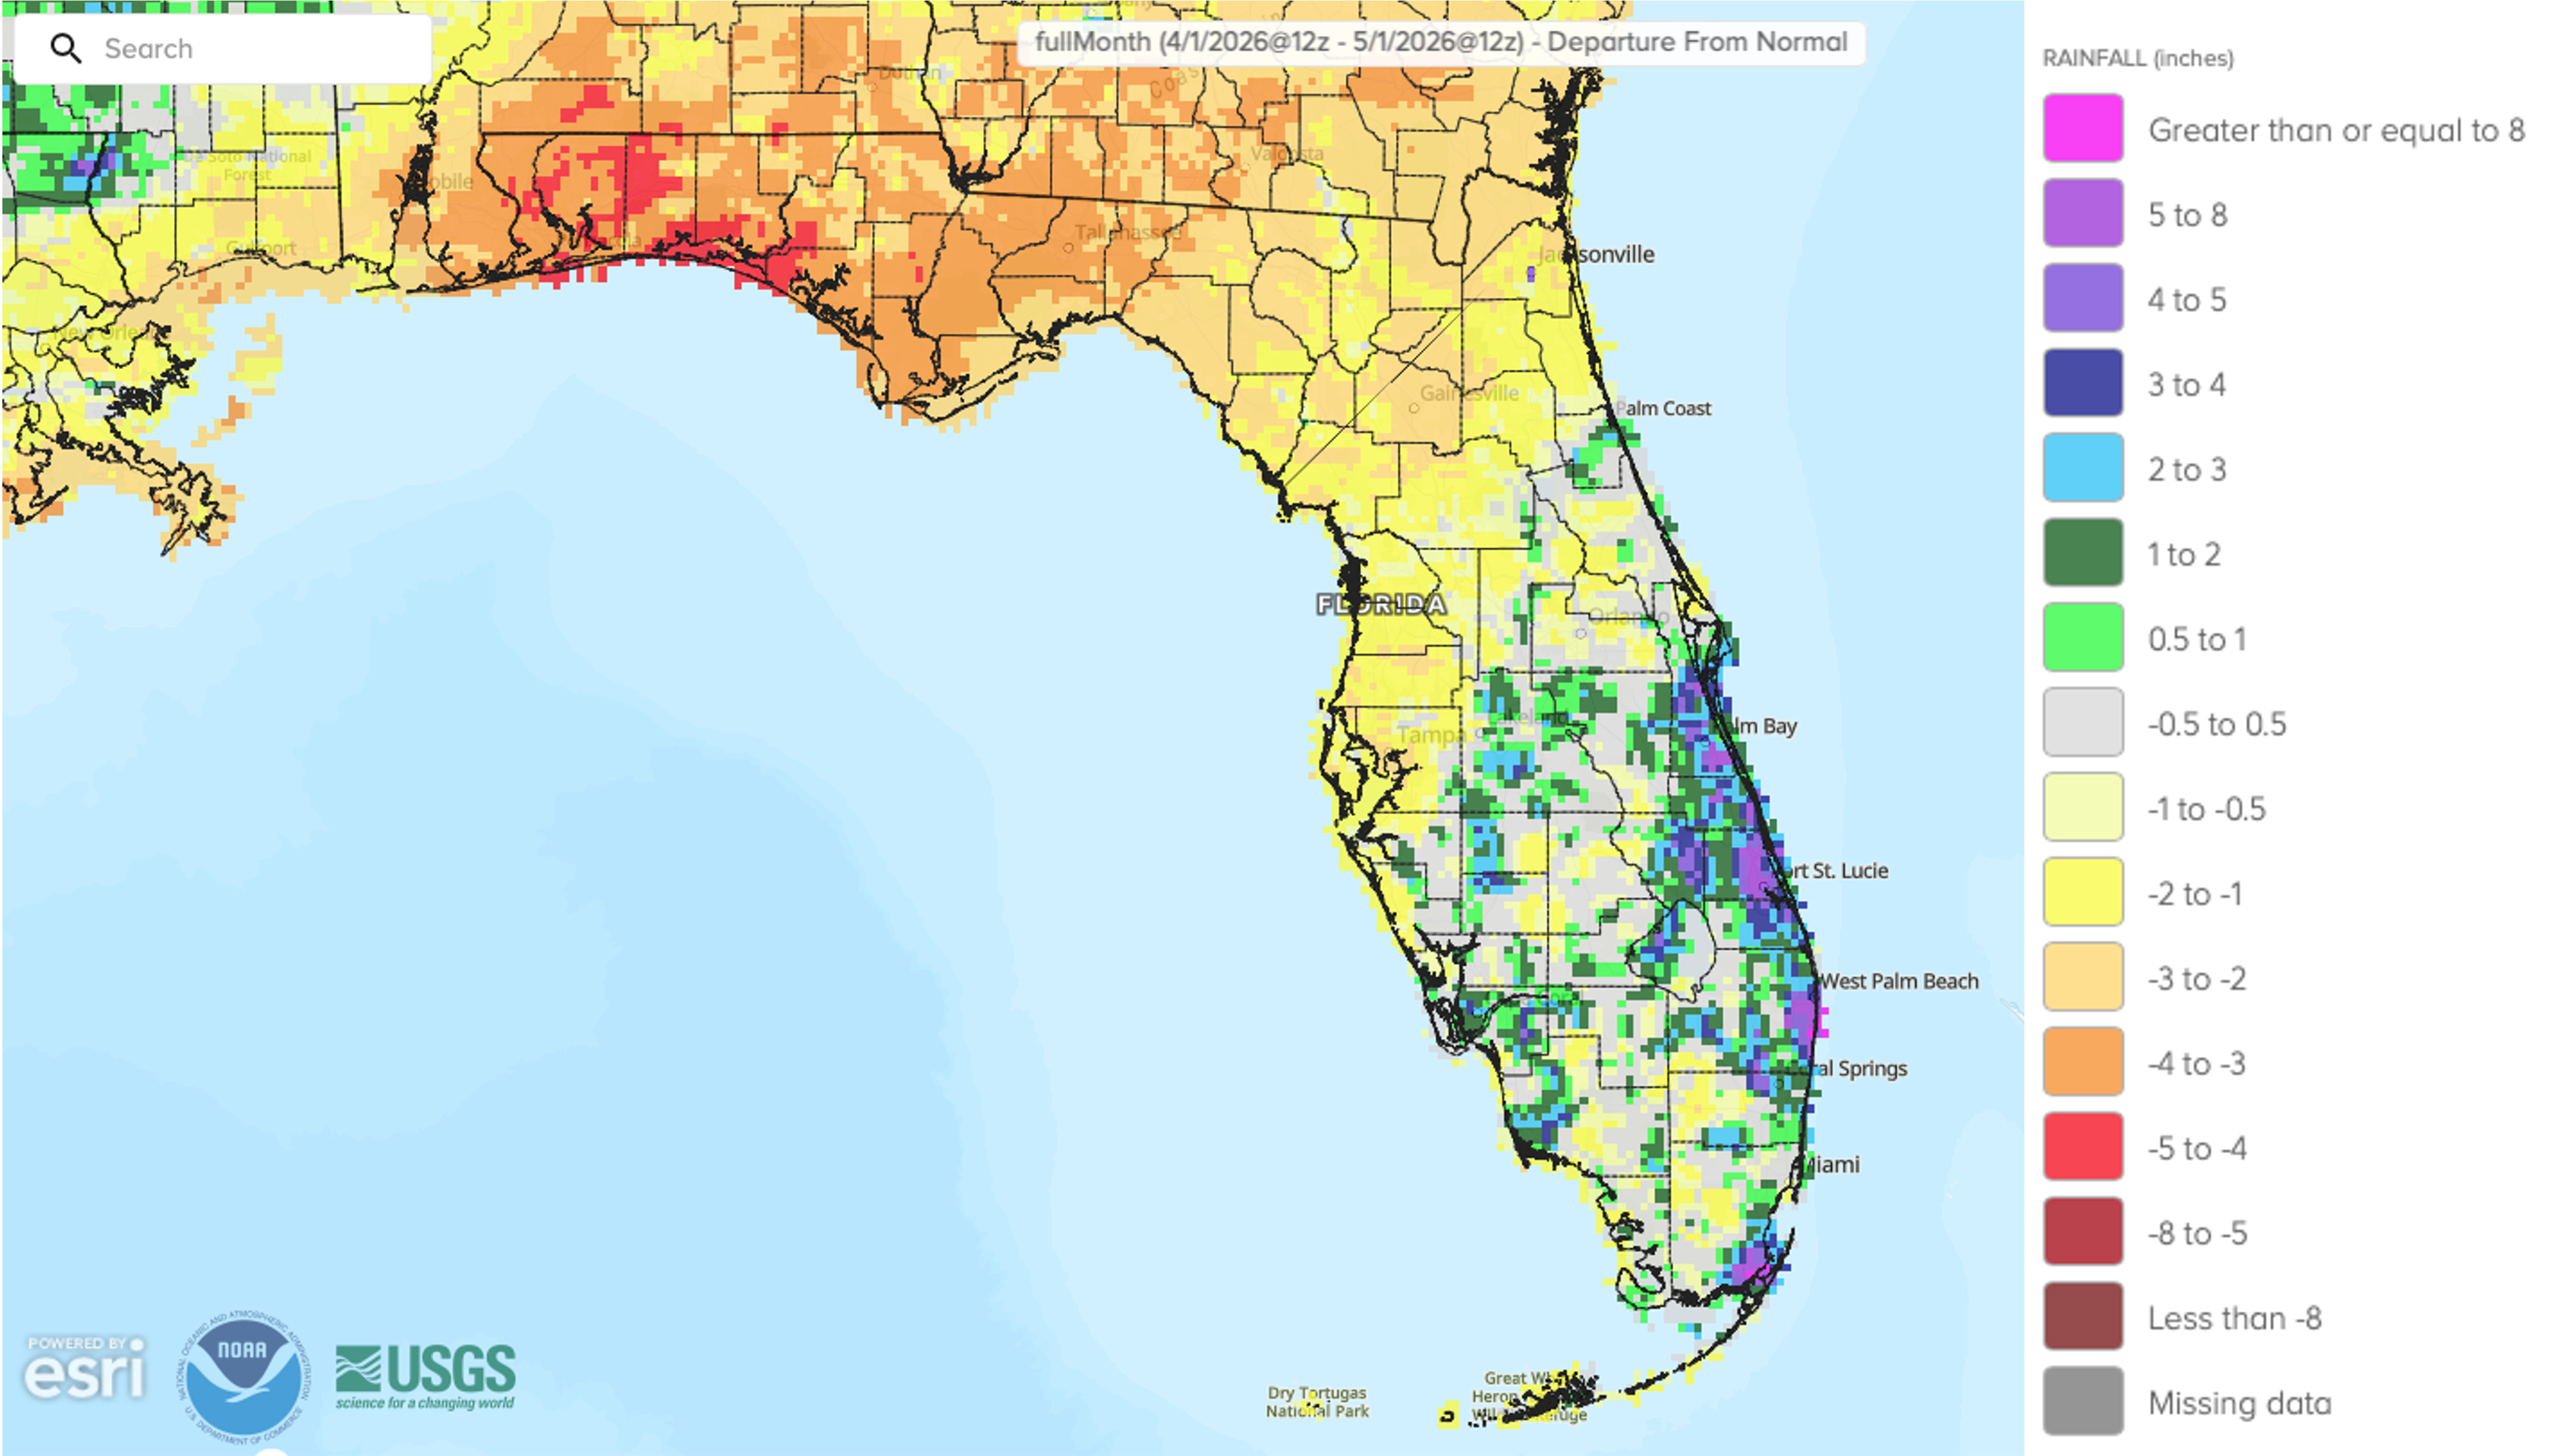
Monthly precipitation totals in April were below normal across northern Florida, while parts of the central and southern Peninsula received above normal rainfall. The monthly precipitation departures from normal ranged from -4.41 inches in Pensacola to +4.61 inches in West Palm Beach (see Table 2 and Appendix 1 for select locations). Northern and central areas of the state continued to see below normal rainfall over the past month. April monthly rainfall totals were generally 25% or less of normal rainfall, with monthly deficits ranging between 2 and 4+ inches below normal in these regions. Central Florida registered between 1 and 2 inches below normal for the month. Eastern coastal areas and isolated areas of south-central Florida, including parts of southwest Florida, received above normal rainfall. Along the eastern coast stretching from Melbourne south to West Palm Beach, monthly rainfall totals were 200% or more of normal, with monthly surpluses ranging from 2 to over 5 inches above normal. That beneficial rainfall has helped improve drought conditions along the eastern coast.
Table 2. April precipitation totals and departures from normal (inches) for selected cities.
| Station | Total Rainfall | Departure from Normal |
| Pensacola | 1.11 | -4.41 |
| Tallahassee | 0.41 | -3.12 |
| Jacksonville | 0.87 | -2.06 |
| Orlando | 1.98 | -0.60 |
| Tampa | 0.68 | -1.87 |
| Miami | 3.32 | -0.04 |
| Key West | 1.19 | -0.88 |
Figure 2. A graphical depiction of the monthly rainfall departure from normal (inches) for April 2026 (courtesy of NOAA, NWS).
ENSO-Neutral Conditions / El Niño Watch.
Over the past month, the state of the tropical equatorial Pacific Ocean transitioned from a La Niña to ENSO-neutral conditions. Near-average sea surface temperatures emerged in the central and east-central equatorial Pacific Ocean, while equatorial sub-surface temperatures increased for the fifth consecutive month. ENSO-neutral conditions are favored to persist through May-June 2026 (80% chance). A transition to El Niño is likely thereafter (61% chance during May-July 2026 and near 80% during June-August 2026) due to increasing subsurface temperature anomalies and westerly wind anomalies over the western Pacific Ocean. The possible outcomes range from ENSO-neutral to a very strong El Niño event (SSTs in the Niño-3.4 region ≥ +2.0°C) during the Northern Hemisphere 2026-2027 winter.
Hazardous Weather Events in April.
According to the Local Storm Reports issued by the local National Weather Service offices serving Florida, there were 110 individual local reports of hazardous weather events recorded across the state during the month of April (see Table 3 for a breakdown by event type). Several incidents related to rip currents were reported during the month, including at least 6 injuries and 4 fatalities. Thunderstorms caused some damage and brief street flooding in portions of the state. On the 7th, a severe thunderstorm with straight line winds damaged two homes in Hialeah, and one brief tornado, rated EF0, was reported in the Palm Springs North community in Miami-Dade County on the same day. Several wildfires were reported throughout the month with ongoing extreme to exceptional drought conditions in much of the state. Among the largest wildfires reported included the Newman Dr. Fire in Collier County, the Railroad Complex Fire in Clay and Putnam Counties, the MM-45 wildfire in Broward County, and the Hwy 41 wildfire in the Everglades in Miami-Dade County. Several fires led to evacuations of nearby residential areas.
Table 3. Breakdown of storm reports submitted in Florida during the month of April (compiled from Iowa State University/Iowa Environmental Mesonet).
| Report Type | Number of Reports |
| Heavy Rain | 5 |
| Flood | 5 |
| Hail | 3 |
| Marine Thunderstorm Wind | 10 |
| Non-Thunderstorm Wind Gust | 40 |
| Tornado/Waterspout/Funnel Cloud | 1 / 3 / 5 |
| Thunderstorm Wind Damage | 1 |
| Non-Thunderstorm Wind Damage | 0 |
| Thunderstorm Wind Gust | 6 |
| Wildfire | 26 |
| Rip Currents | 5 |
Daily Record Events in April.
Table 4. Summary of daily records broken or set in Florida in April 2026 (source: NCEI Daily Weather Records).
| Category | Number of Records |
| Highest daily max. temp. | 12 |
| Highest daily min. temp. | 1 |
| Lowest daily max. temp. | 0 |
| Lowest daily min. temp. | 6 |
| Highest daily precipitation | 16 |
| Total | 35 |
Drought-Related Impacts.
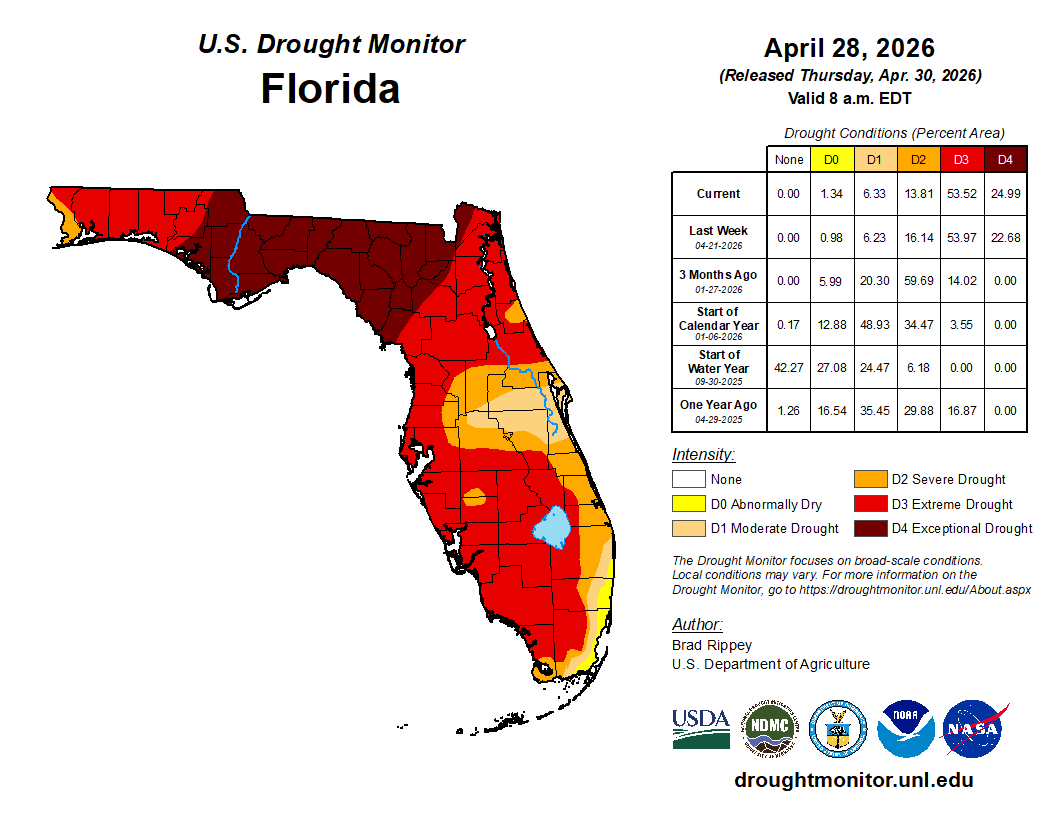
Drought conditions persisted during April, with some degradation in northern parts of the state and improvements in southeastern areas that received beneficial rainfall. By mid-month, approximately 20% of the state was in exceptional drought (D4), 51% of the state in extreme drought (D3), 22% in severe drought (D2), and 6% was in moderate drought (D1), with 1% of the state abnormally dry (D0), according to the U.S. Drought Monitor. By the end of the month, approximately 25% of the state was in exceptional drought (D4), 54% was in extreme drought (D3), 14% was in severe drought (D2), and 6% was in moderate drought (D1), with 1.3% abnormally dry (D0) (Figure 2 below).
As of April 30, the Lake Okeechobee water level was 11.67 ft. above sea level (Feet-NGVD29), which is below average for this time of year. At the first of April, the water level was 12.01 ft. above sea level.
Figure 3. A graphical depiction of the latest drought conditions in Florida according to the U.S. Drought Monitor (courtesy of the National Drought Mitigation Center, University of Nebraska-Lincoln).
Agriculture-Related Impacts.
Extreme to exceptional drought conditions, elevated wildfire activity, and low soil moisture and pond levels in much of the state have continued to impact farming conditions and crops. In mid-April, topsoil moisture conditions were adequate in 40% of the state, short in 31%, and very short in 20% of the state, while 9% of the state had surplus topsoil moisture conditions. By the end of April, topsoil moisture conditions were adequate in 38% of the state, short in 20%, and very short in 31% of the state, while 11% of the state had surplus topsoil conditions. For more information, consult the Crop Progress and Conditions report, which are published by the USDA’s National Agricultural Statistics Service.
Appendix 1
Additional April departures from normal data for select Florida locations (source: NWS).
| Station | Average Temperature (˚F) | Departure from Normal (˚F) | Total Rainfall (in.) | Departure from Normal (in.) |
| Gainesville | 71.2 | +2.7 | 0.10 | -2.64 |
| Sarasota | 75.8 | +3.2 | 1.67 | -0.79 |
| Melbourne | 74.3 | +2.5 | 4.14 | +1.85 |
| Fort Myers | 76.4 | +1.6 | 1.83 | -0.61 |
| West Palm Beach | 77.1 | +2.2 | 8.29 | +4.61 |
Appendix 2
Select daily record high maximum temperatures tied or broken during April (compiled from NOAA).
| Station | Date | Record (˚F) | Broken/Tied | Last |
| Cross City | 4 | 88 | Tied | 88 in 2007 |
| Chipley | 15 | 89 | Tied | 89 in 1945 |
| Gainesville | 15 | 89 | Broken | 88 in 2013 |
| Jacksonville | 16 | 90 | Tied | 90 in 1972 |
| Gainesville | 17 | 91 | Broken | 89 in 1967 |
| Cross City | 17 | 88 | Broken | 87 in 2022 |
| Gainesville | 18 | 92 | Broken | 91 in 1967 |
| Glen St. Mary | 20 | 93 | Broken | 91 in 2011 |
| Lake City | 20 | 92 | Broken | 91 in 2011 |
| Apalachicola | 26 | 88 | Broken | 86 in 2006 |
| Venice | 27 | 91 | Tied | 91 in 2015 |
| Jacksonville | 29 | 95 | Broken | 93 in 1991 |
| Glen St. Mary | 30 | 93 | Broken | 92 in 1985 |
| Vero Beach | 30 | 91 | Broken | 89 in 1964 |
Prepared by Florida Climate Center
The Florida State University
Tallahassee, FL
November Key Points:
- Temperatures were below normal across the state for the month.
- Precipitation in the Florida Panhandle was below normal in November, the first time in 7 months for some places in the region, while precipitation in the rest of the state was above normal.
- Abnormally dry conditions emerged in the northern Panhandle region toward the end of the month.
- The 2021 Atlantic Hurricane Season officially ended as the third most active year on record.
- The December outlook favors above normal temperatures and continued dryness with below normal precipitation.
Average temperatures in November were below normal across the state. Average temperature departures ranged from -4.3 ̊F in Jacksonville to -0.4 ̊F in Orlando for the month (see Table 1 and Appendix 1 for select cities). Much of the state experienced cooler-than-normal temperatures during the month and especially during the first half of the month. Only one daily high maximum temperature record was set, and no daily high minimum temperature records were set during the month; however, there were several daily low maximum temperature records set, particularly early in the month.
Table 1. November average temperatures and departures from normal ( ̊F) for selected cities.
| Station | Mean Temperature | Departure from Normal |
| Pensacola | 59.8 | -1.6 |
| Tallahassee | 57.2 | -3.0 |
| Jacksonville | 58.0 | -4.3 |
| Orlando | 67.8 | -0.4 |
| Tampa | 68.4 | -1.4 |
| Miami | 73.1 | -1.7 |
| Key West | 73.9 | -2.7 |
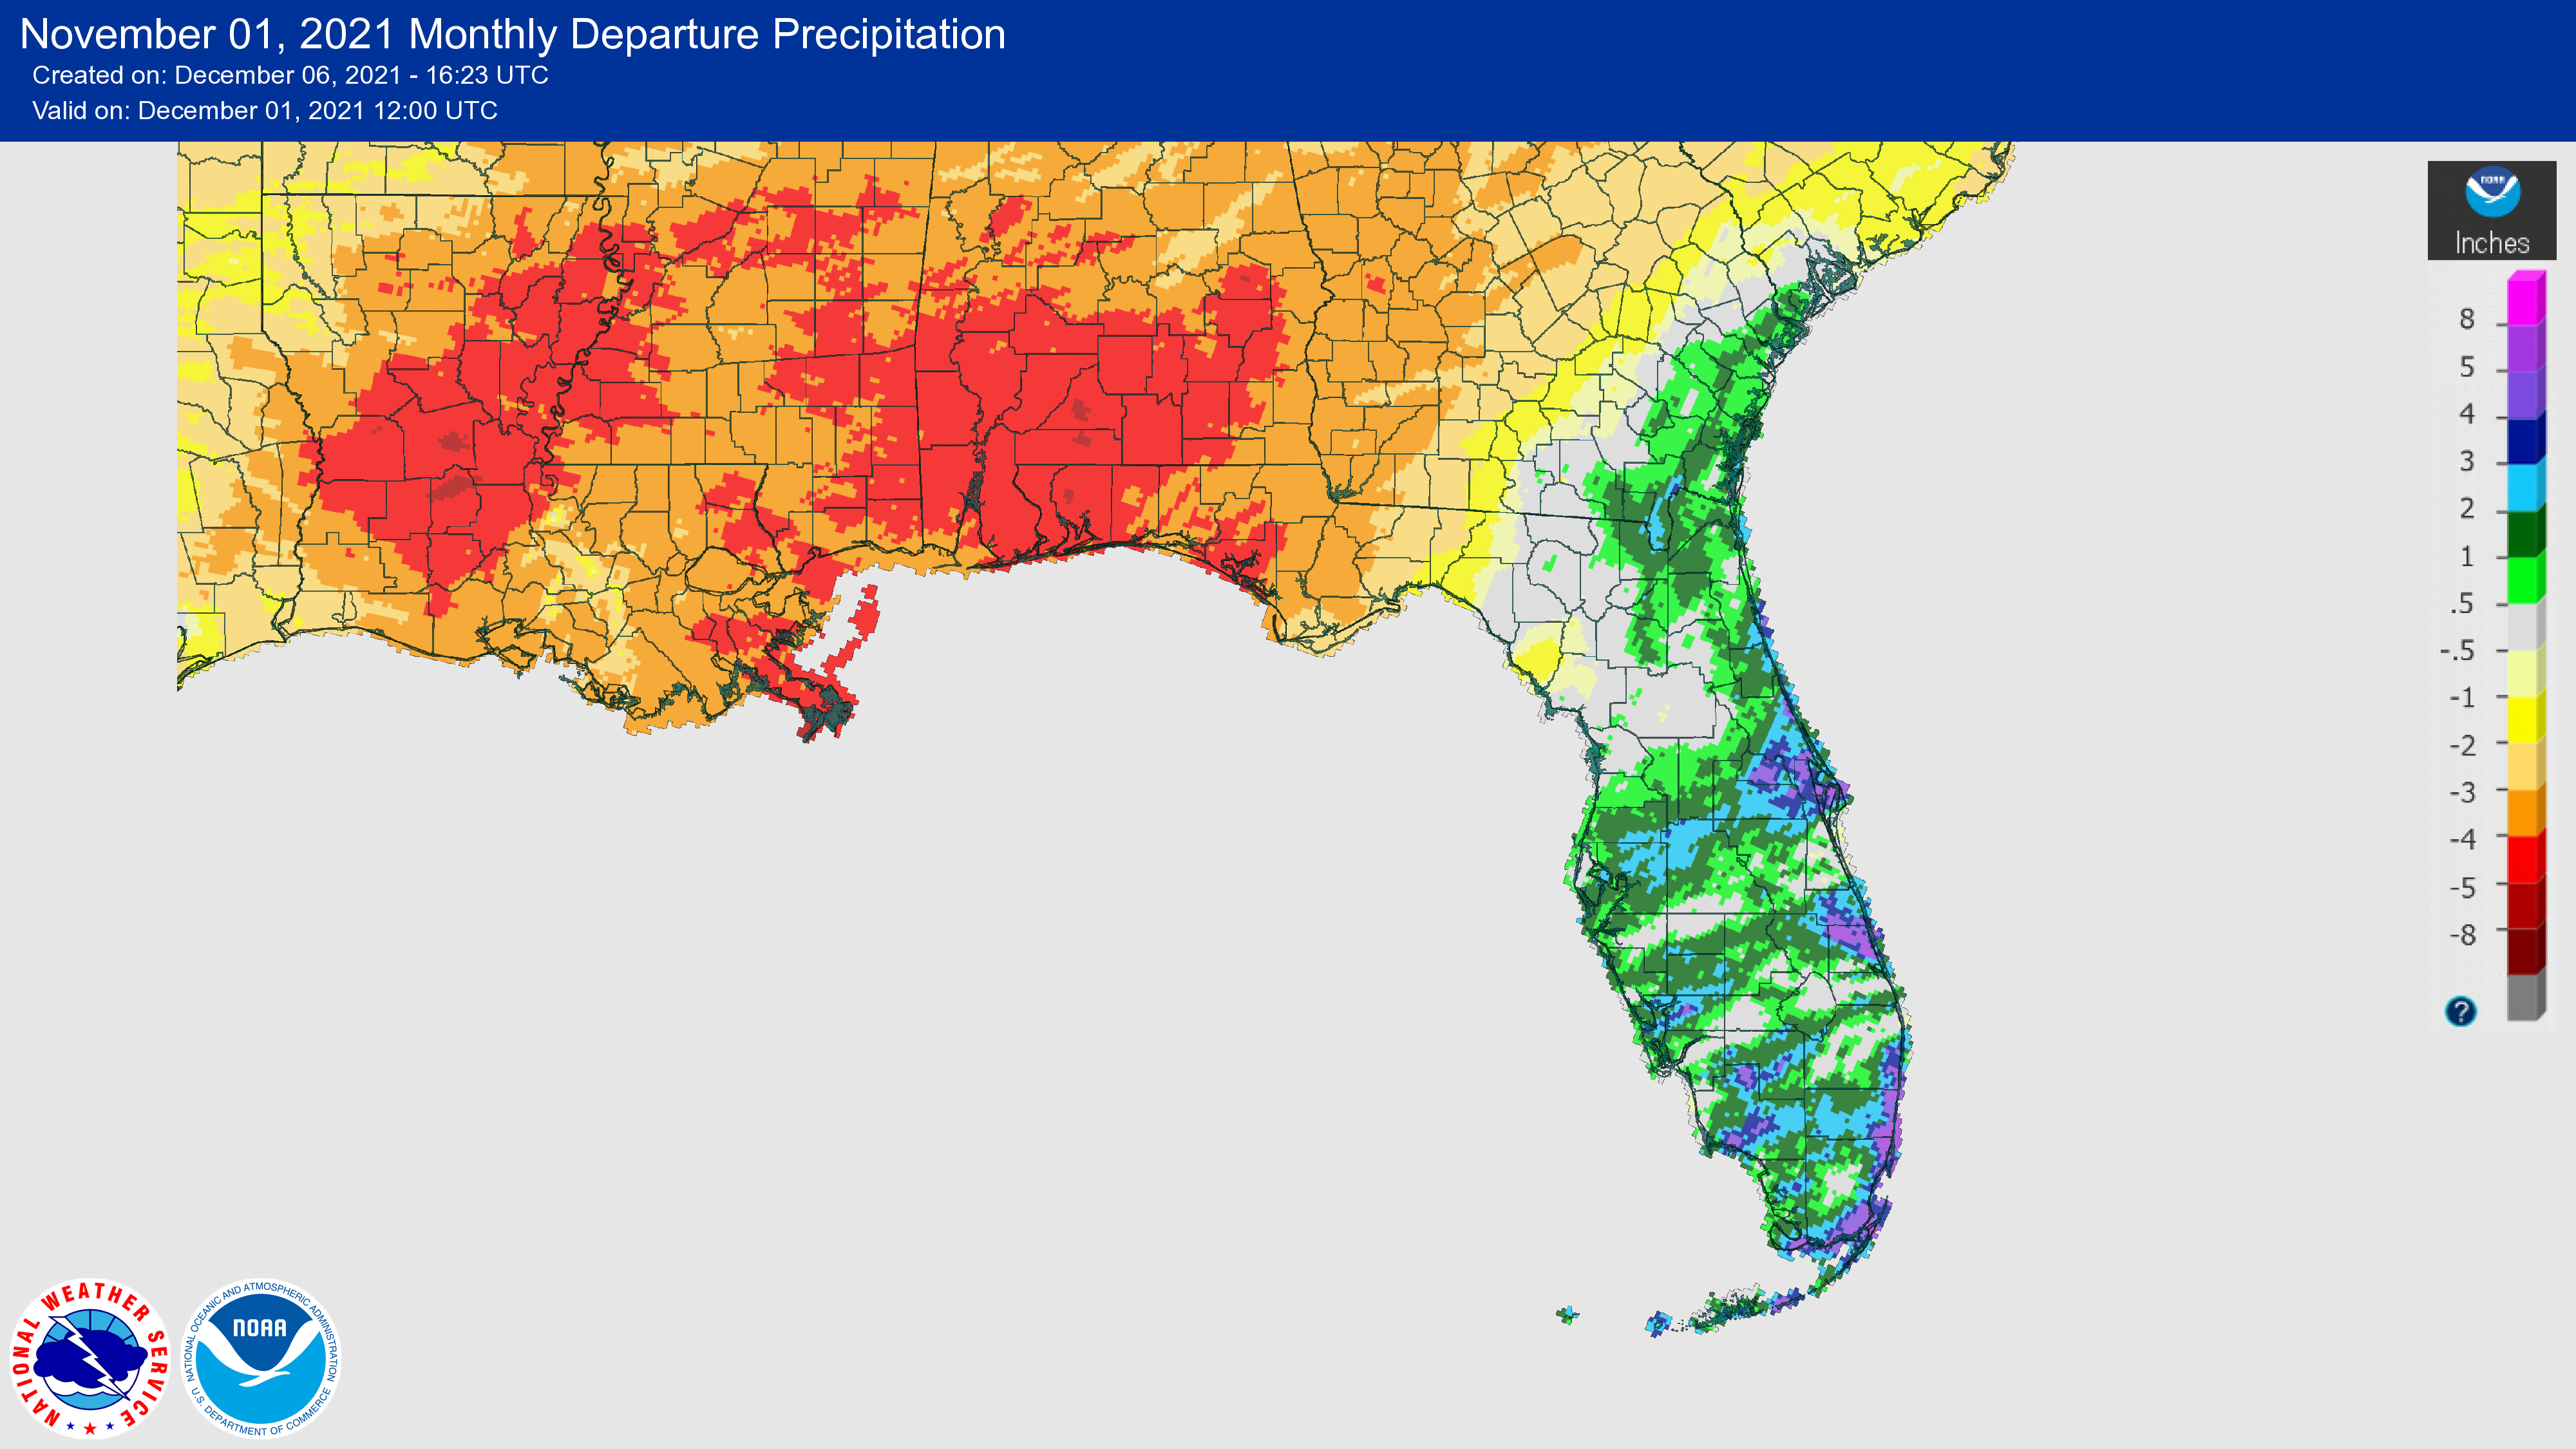
Rainfall totals in November were below normal in the Panhandle and above normal across the Peninsula (Figure 1). Monthly departures from normal ranged from -4.11 inches in Pensacola to +2.41 inches in Orlando (Table 2 and Appendix 1). Much of the Panhandle was drier than normal, and the western Panhandle broke its wet streak with above normal precipitation for the past several months. Pensacola has had wetter than normal conditions since April, but it experienced its fourth driest November on record. Pensacola maintains a surplus in annual rainfall due to excessive rainfall in prior months with an annual total of 86.65 inches so far, which is just shy of 24 inches above normal to date. Venice and Hollywood had their second wettest Novembers on record.
Table 2. November precipitation totals and departures from normal (inches) for selected cities.
| Station | Total Rainfall | Departure from Normal |
| Pensacola | 0.31 | -4.11 |
| Tallahassee | 0.58 | -2.52 |
| Jacksonville | 3.19 | +1.19 |
| Orlando | 4.20 | +2.41 |
| Tampa | 3.52 | +2.12 |
| Miami | 4.38 | +0.85 |
| Key West | 2.80 | +0.75 |
Figure 1. A graphical depiction of the monthly rainfall departure from normal (inches) for November (courtesy of NOAA, NWS).
La Niña Advisory.
La Niña conditions, the cool phase of the ENSO climate pattern, returned to the tropical Pacific Ocean in October. Below-average subsurface temperatures (averaged from 180-100°W) strengthened significantly over the past month, as negative anomalies were observed at depth across most of the central and eastern Pacific Ocean. There is now a 90% chance of La Niña conditions continuing in the Northern Hemisphere winter, and it is likely to continue into spring 2022 (~50% during March-May). At its peak, a moderate-strength La Niña is favored. ENSO-neutral conditions could potentially return during April-June 2022.
Hazardous Weather Events in November.
According to the Local Storm Reports issued by the local National Weather Service offices serving Florida, there were 209 individual local reports of hazardous weather events recorded across the state during the month of November (see Table 4 for a breakdown by event type). Heavy rain affected several parts of the state on the 5th and 6th, including Volusia and Collier Counties which experienced over 7 and 9 inches of rainfall, respectively. Further, high water levels caused coastal flooding in several places across the state on the 7th. The Mayport tide gauge in Duval County reached its 6th highest water level on record at 2.51 feet above MHHW, and the Fernandina Beach tide gauge reached its 7th highest water level on record, reaching 2.93 feet above MHHW. These are the highest water levels ever to occur with a non-tropical weather system. Heavy rainfall again affected parts of the state later in the month. On the 21st, 10-11 inches of rain fell in parts of St. Lucie County near River Park.
Table 4. Breakdown of storm reports submitted in Florida during the month of November (compiled from Iowa State University/Iowa Environmental Mesonet).
| Report Type | Number of Reports |
| Coastal Flood | 67 |
| Flash Flood | 15 |
| Flood | 21 |
| Dense Fog | 1 |
| Heavy Rain | 30 |
| Marine Thunderstorm Wind | 5 |
| Non-Thunderstorm Wind Gust | 54 |
| Non-Thunderstorm Wind Damage | 8 |
| Tornado/Waterspout/Funnel Cloud | 0/1/0 |
| Thunderstorm Wind Damage | 0 |
| Thunderstorm Wind Gust | 6 |
| Lightning | 0 |
| High Surf | 1 |
Drought-Related Impacts.
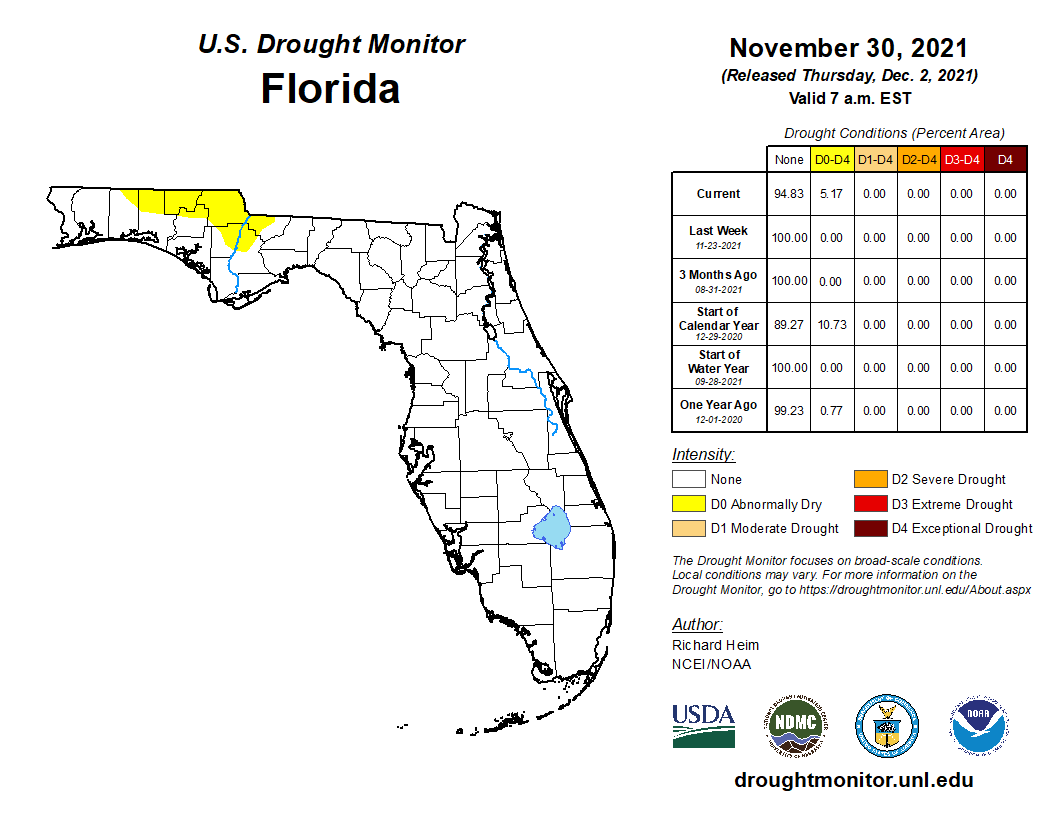
Much of November remained drought free across the state. Northeast Florida experienced abnormally dry conditions (D0) in early November but was drought free by mid-month. By November 30, abnormally dry conditions emerged in northern sections of the Panhandle, with 5.2% of the state experiencing abnormally dry conditions according to the U.S. Drought Monitor.
As of November 30, the Lake Okeechobee water level was at 15.94 ft. above sea level (Feet-NGVD29), which is above the average for this time of the year. The water level remained above average throughout the month. At the first of the month, the water level was 15.85 ft. above sea level.
Agriculture-Related Impacts.
During mid-November, topsoil moisture levels were adequate for 72% of the state, short in 10%, and very short in 1% of the state; 17% of the state was in surplus. By the end of November, topsoil moisture levels were adequate in 65% of the state, short in 24%, and very short in 2%; 9% of the state was in surplus. For more information, consult the weekly Crop Progress and Conditions report published by the USDA's National Agricultural Statistics Service.
Appendix 1
Additional November departures from normal data for select Florida locations (Source: NWS).
| Station | Average Temperature (˚F) | Departure from Normal (˚F) | Total Rainfall (in.) | Departure from Normal (in.) |
| Gainesville | 59.8 | -2.9 | 3.36 | +1.57 |
| Sarasota | 67.6 | -2.5 | 1.44 | -0.37 |
| Melbourne | 67.0 | -3.7 | 4.20 | +1.65 |
| Fort Myers | 70.8 | -0.7 | 2.45 | +0.67 |
| West Palm Beach | 71.5 | -1.5 | 6.54 | +2.92 |
Building A, Suite 292
Tallahassee, FL 32306-2741
Phone: (850) 644-3417 | (850) 644-0719
climate@coaps.fsu.edu