Prepared by Florida Climate Center
Florida State University
Tallahassee, FL

Summary:
- Monthly average temperatures in October were generally near to above normal for the month.
- Monthly precipitation totals in October were above to well above normal, except in southern Florida which saw below normal precipitation.
- Drought improved during October and by the end of the month about 4% of the state was in severe drought (D2), 20% was in moderate drought (D1), and 33% was abnormally dry (D0), according to the U.S. Drought Monitor.
- El Niño continued to strengthen in the tropical equatorial Pacific Ocean and is expected to become a very strong event. There is an 83% chance of an historic event during October-December 2026 that would exceed the strength of previous El Niño events.
- October featured impactful weather, including Hurricane Isaias, which made landfall at Category 2 strength on October 9 near Destin, FL, and record high tide flooding across the east coast of Florida.
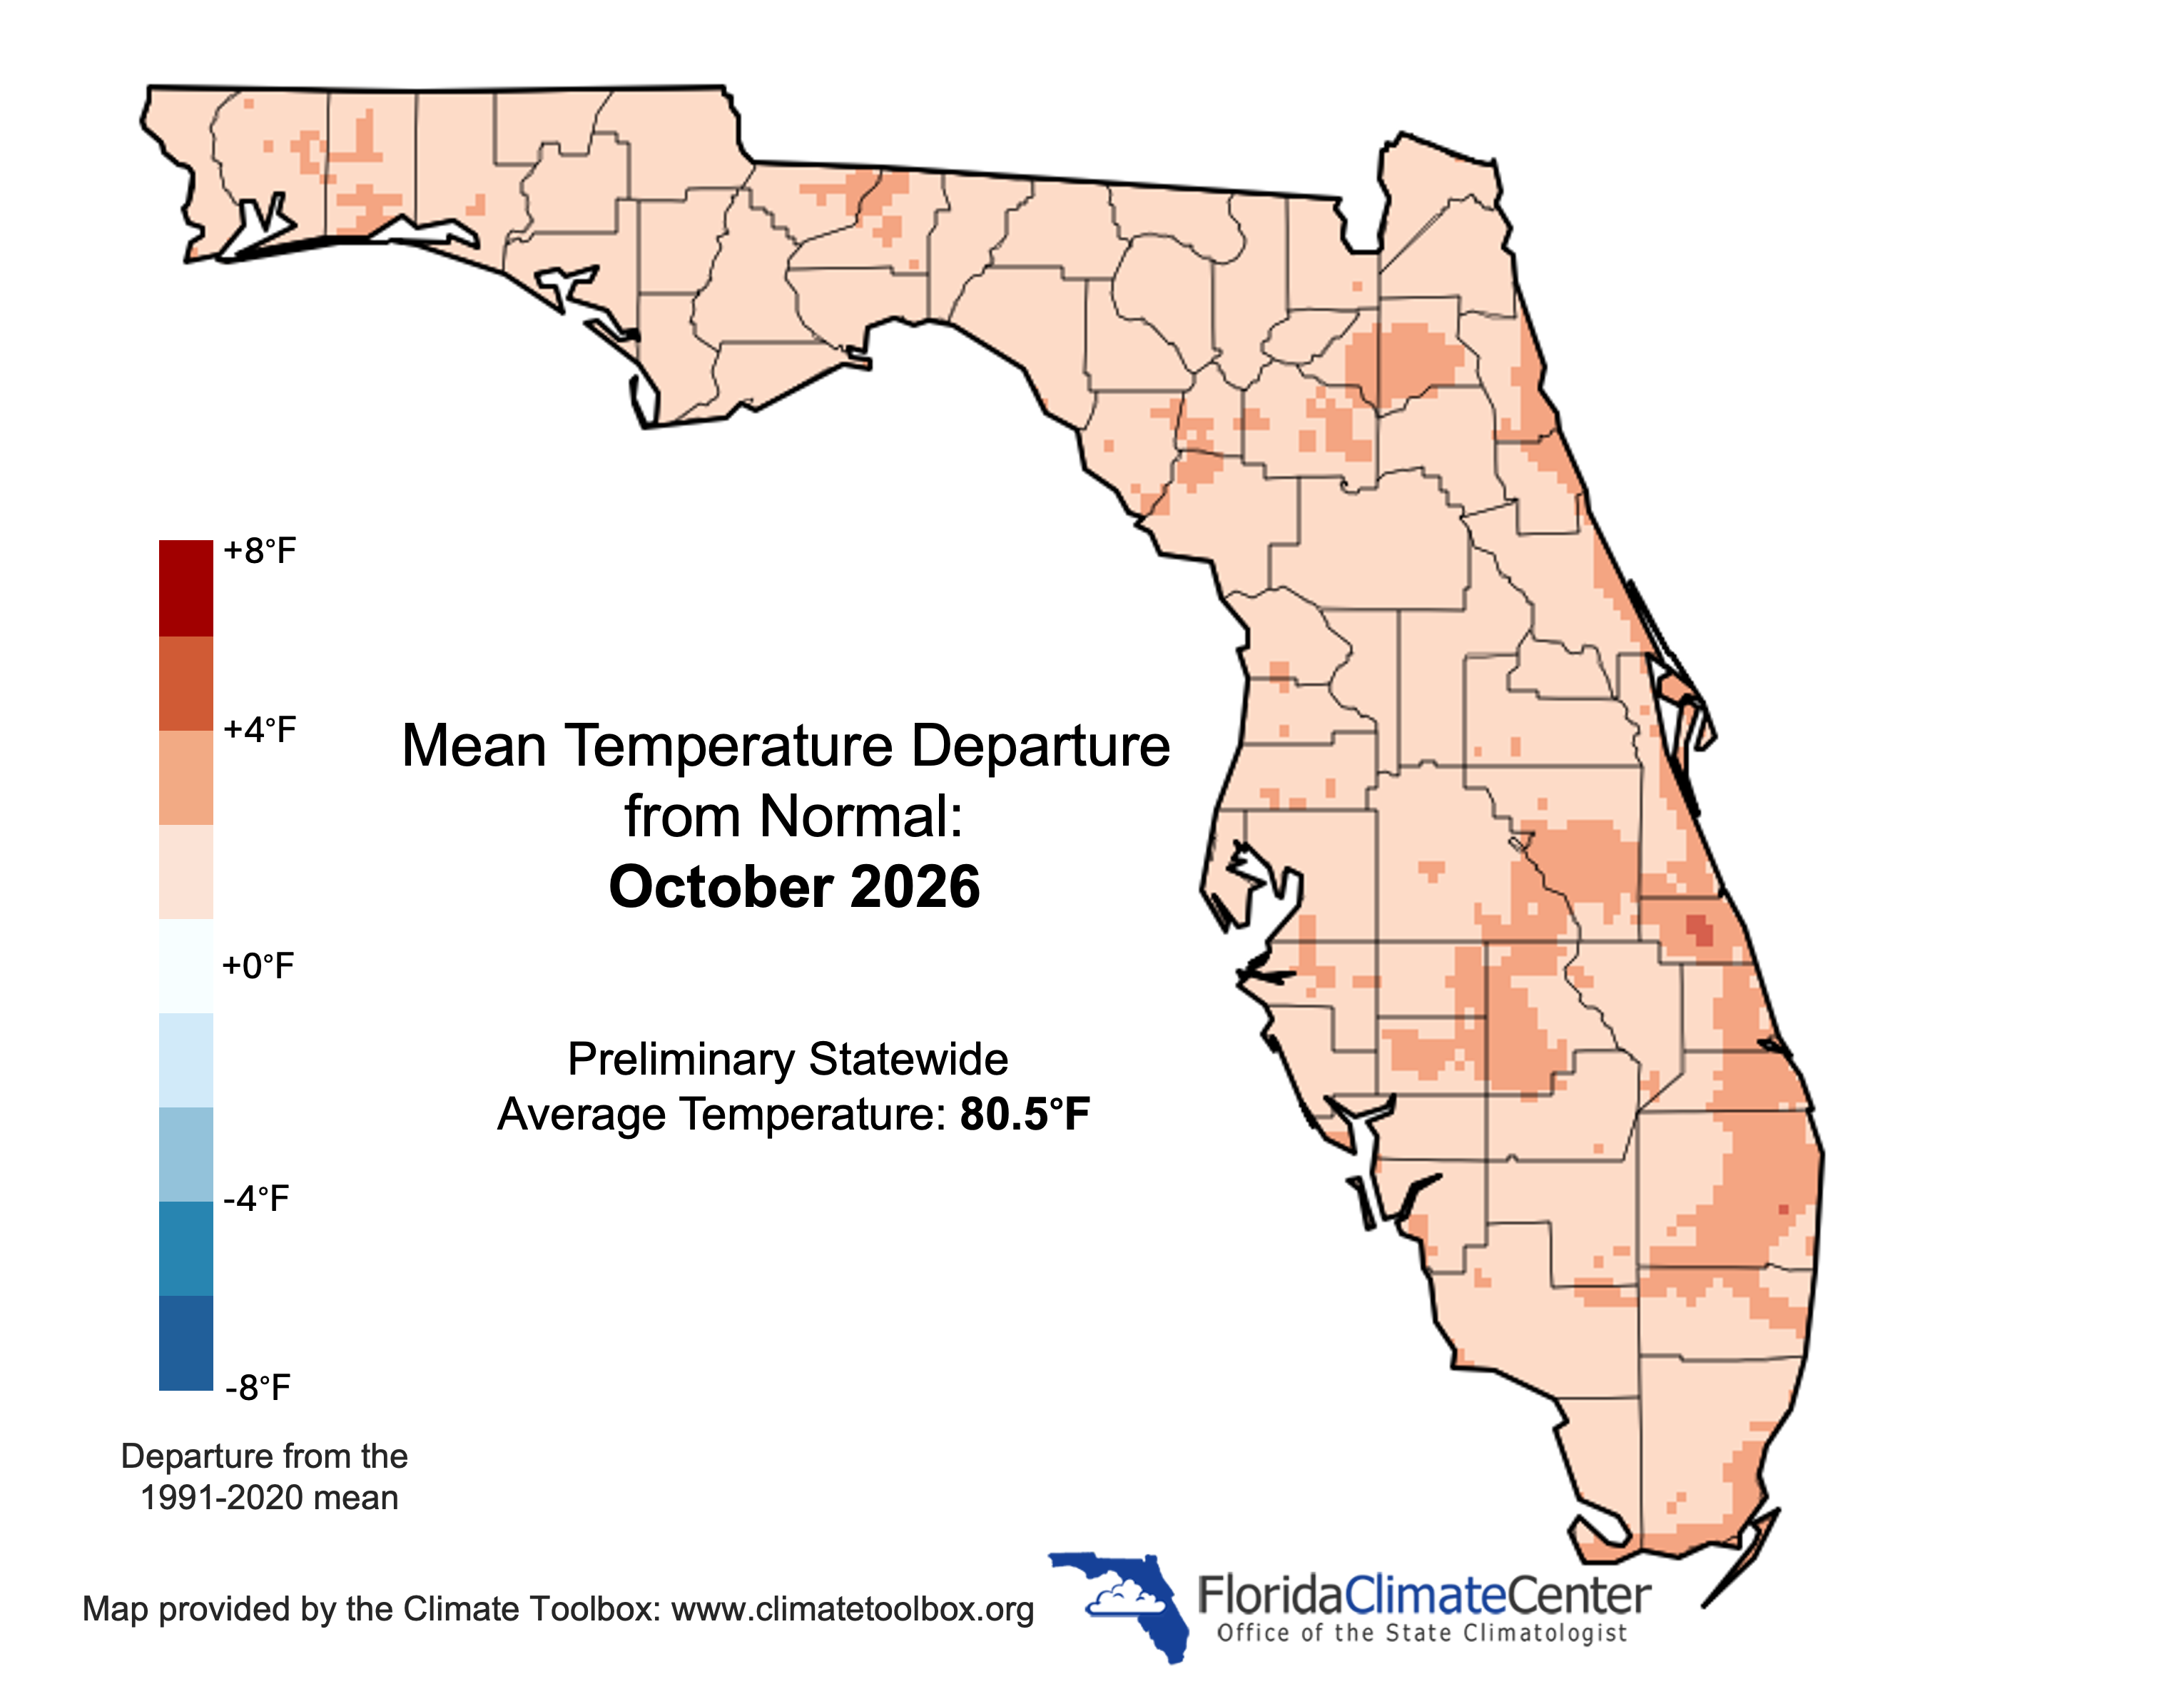
Monthly average temperatures in October were generally near to above normal for the month. Average monthly temperature departures from normal ranged from +0.5 ̊F in Tampa to +2.5 ̊F in Orlando (see Table 1 and Appendix 1 for select cities). Monthly average maximum temperatures were more mild throughout the month, while monthly average minimum temperatures were much above normal, especially across central and south Florida. Monthly minimum temperatures ranked in the top 5 warmest on record for October in Sanford (tied for 4th-warmest in 78 years), Melbourne (5th-warmest in 27 years), Sarasota/Bradenton (4th-warmest in 115 years), Stuart (4th-warmest in 77 years), Fort Lauderdale (tied for 5th-warmest in 111 years), Miami (5th-warmest in 90 years), and Marathon (3rd-warmest in 52 years). For the season to date, September-October, many locations are experiencing one of their top 10 warmest falls on record based on average temperatures. Select daily record high maximum temperatures tied or broken during October are provided in Appendix 2.
Table 1. October average temperatures and departures from normal ( ̊F) for select cities.
| Station | Mean Temperature | Departure from Normal |
| Pensacola | 72.1 | +0.8 |
| Tallahassee | 71.6 | +1.3 |
| Jacksonville | 72.0 | +0.8 |
| Orlando | 78.0 | +2.5 |
| Tampa | 77.9 | +0.5 |
| Miami | 81.6 | +1.5 |
| Key West | 82.2 | +0.9 |
Figure 1. Monthly average temperature departures from normal (°F) in Florida for October 2026.
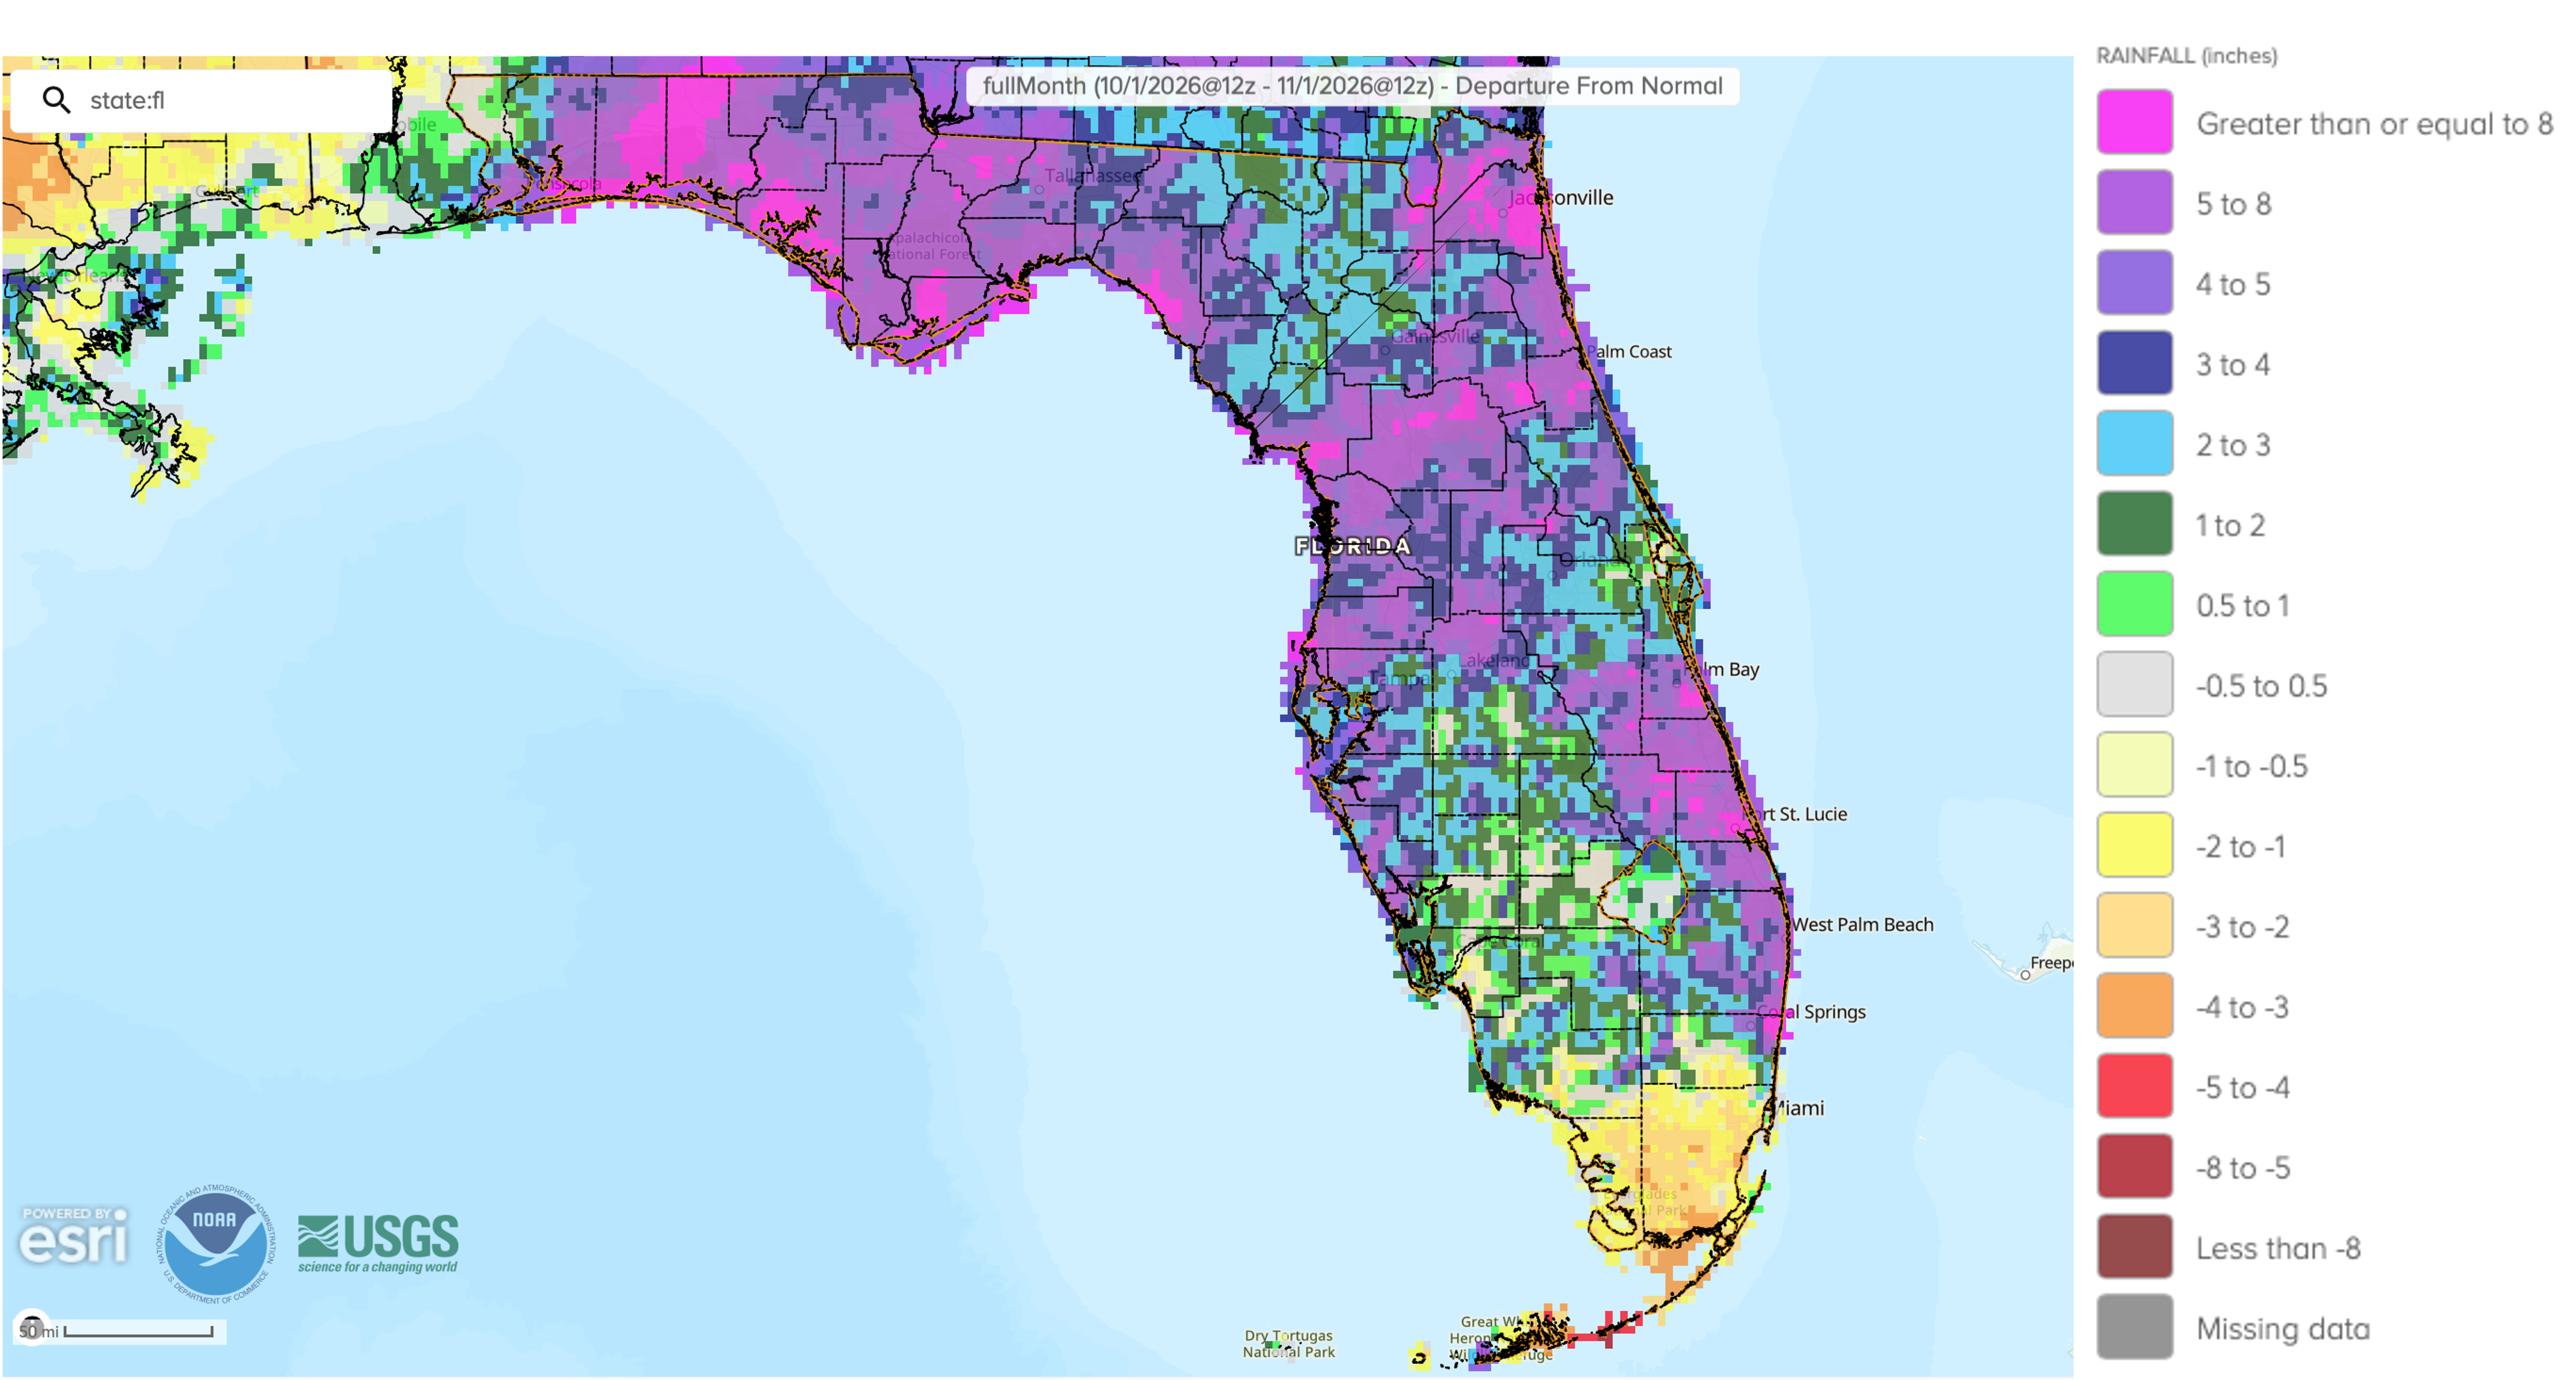
Monthly precipitation totals in October were above to well above normal, except in southern Florida which saw below normal precipitation. The monthly precipitation departures from normal ranged from -5.91 inches in Marathon to +11.33 inches in Stuart (see Table 2 and Appendix 1 for select locations). In Stuart, the monthly rainfall total was 15.31” which ranked 5th-wettest October on record (77 years). Apalachicola totaled 15.36” for the month, which was +10.98” above average and ranked 2nd-wettest on record (86 years). Melbourne received 13.38” of rain, which was +8.52” above normal and ranked 2nd-wettest on record. Pensacola, Jacksonville, and Sarasota all saw rainfall surpluses over 7” for the month, ranking 7th-, 3rd (tied), and 5th-wettest on record, respectively, for October. Monthly rainfall in the Florida Panhandle fell mostly during the first 1.5 weeks, and, despite ending up above normal for the month, the rest of October was dry and places like Tallahassee and Crestview experienced 21 and 22 consecutive dry days, respectively, with no rainfall.
The month brought periods of heavy rain due to Hurricane Isaias and frontal systems that moved through the state. On October 5, Apalachicola recorded a 1-day rainfall total of 7.49”, which tied as the wettest October day and tied as the 6th-wettest day on record overall (since 1975). The metro Jacksonville area received 4-9” of rain in the overnight hours of October 6-7. Hurricane Isaias, which was the first hurricane of the Atlantic hurricane season and a category 3 storm at its peak, brought heavy rainfall to the western Florida Panhandle. Among the largest storm totals included 12.43” in DeFuniak Springs, 11.65” in Fort Walton Beach, and 9.64” in Valparaiso. Destin recorded 7.50”, while Tallahassee received as much as 7.81”, according to CoCoRaHS reports and preliminary reports from the NWS.
For the season to date, September-October, many locations are experiencing well above normal precipitation, including Fort Lauderdale with 30.36” (+14.97”), Sarasota with 21.59” (+11.28” and 4th- wettest period on record), West Palm Beach with 22.90” (+9.04”), and Melbourne with 19.95” (+7.46”). Some southerly locations are experiencing season-to-date deficits, however, including Marathan with a total of 6.12” (-7.80” and10th-driest season-to-date on record), Miami with 12.21” (-5.66”), and Fort Myers with 6.84” (-5.24”).
Table 2. October precipitation totals and departures from normal (inches) for selected cities.
| Station | Total Rainfall | Departure from Normal |
| Pensacola | 12.23 | +7.53 |
| Tallahassee | 6.71 | +3.47 |
| Jacksonville | 11.45 | +7.42 |
| Orlando | 4.85 | +1.39 |
| Tampa | 5.47 | +3.13 |
| Miami | 4.90 | -2.75 |
| Key West | 5.88 | +0.21 |
Figure 2. A graphical depiction of the monthly rainfall departure from normal (inches) for October 2026 (courtesy of NOAA, NWS).
El Niño Advisory in the Pacific Ocean.
El Niño continues to strengthen in the tropical equatorial Pacific Ocean. The latest ENSO forecast indicates an 83% chance or more for a strong to very strong event through January-March 2027. Sea surface temperature anomalies in the Niño monitoring regions of the Pacific Ocean increased over the past month and subsurface ocean temperatures remained +10°C at depth. The coupled ocean-atmosphere system continues to reflect a robust El Niño event. There remains a high chance (83% during October-December 2026) for a historic event that would exceed the strength of all previous El Niño events dating back to 1950, which substantially increases the odds for experiencing typical El Niño impacts in Florida.
Hazardous Weather Events in October.
According to the Local Storm Reports issued by the local National Weather Service offices serving Florida, there were 300 individual local reports of hazardous weather events recorded across the state during the month of October (see Table 3 for a breakdown by event type). Hurricane Isaias became the first hurricane of the season and reached category 3 strength with peak winds of 120 mph. The storm made landfall on the evening of October 9 near Destin, Florida as a category 2 hurricane with maximum sustained winds of 105 mph. Isaias generated heavy rainfall, strong wind gusts in excess of 100 mph in areas near and just west of the eyewall, and 1 tornado in Florida, which moved onshore east of Eastpoint in Franklin County and caused minor damage to homes. One fatality was reported from the storm due to a downed tree in Escambia County, and injuries were reported from a car crash in Jackson County due to a tree in the road. From October 23-27, a Florida Nor’easter brought strong and persistent onshore winds across the entire eastern coast of Florida which coincided with king tides and resulted in moderate to major coastal flooding and erosion, along with isolated areas of moderate rainfall. Several tide gauges recorded record high tide levels, leading to closed roadways, closed businesses, and standing water in low-lying areas.
Table 3. Breakdown of storm reports submitted in Florida during the month of October (compiled from Iowa State University/Iowa Environmental Mesonet).
| Report Type | Number of Reports |
| Heavy Rain | 24 |
| Flood | 21 |
| Flash Flood | 39 |
| Hail | 5 |
| Lightning | 0 |
| Marine Thunderstorm Wind | 26 |
| Non-Thunderstorm Wind Gust | 41 |
| Tornado/Waterspout/Funnel Cloud | 1 / 4 / 2 |
| Thunderstorm Wind Damage | 1 |
| Non-Thunderstorm Wind Damage | 1 |
| Thunderstorm Wind Gust | 30 |
| Wildfire | 2 |
| Tropical Cyclone | 78 |
Daily Record Events in October.
Table 4. Summary of daily records broken, or set, in Florida in October 2026 (source: NCEI Daily Weather Records).
| Category | Number of Records |
| Highest daily max. temp. | 25 |
| Highest daily min. temp. | 57 |
| Lowest daily max. temp. | 4 |
| Lowest daily min. temp. | 1 |
| Highest daily precipitation | 41 |
| Total | 128 |
Drought-Related Impacts.
Drought improved over the past month across the state. Most areas that were experiencing drought at the beginning of the month saw between a 1- and 2-category improvement in drought over the past 4 weeks. As of October 13th, approximately 5% of the state was in severe drought (D2), 20% was in moderate drought (D1), and 32% was abnormally dry (D0), according to the U.S. Drought Monitor. By the end of October, 4% of the state remained in severe drought (D2), 20% was in moderate drought (D1), and 33% of the state was abnormally dry (D0) (Figure 3 below).
As of October 31, the Lake Okeechobee water level was 12.77 ft. above sea level (Feet-NGVD29), which is below average for the time of year and near the water shortage management level of about 13.00 feet. At the first of October, the water level was 11.93 ft. above sea level.
Figure 3. A graphical depiction of the latest drought conditions in Florida according to the U.S. Drought Monitor (courtesy of the National Drought Mitigation Center, University of Nebraska-Lincoln).

Agriculture-Related Impacts.
In mid-October, topsoil moisture conditions were adequate in 60% of the state, short in 21%, and very short in 10% of the state, while 9% of the state had surplus topsoil moisture conditions. By the end of October, topsoil moisture conditions were adequate in 58% of the state, short in 19%, and very short in 8% of the state, while 15% of the state had surplus topsoil conditions. For more information, consult the Crop Progress and Conditions report, which are published by the USDA’s National Agricultural Statistics Service.
Appendix 1
Additional October departures from normal data for select Florida locations (source: NWS).
| Station | Average Temperature (˚F) | Departure from Normal (˚F) | Total Rainfall (in.) | Departure from Normal (in.) |
| Gainesville | 73.1 | +1.7 | 6.50 | +3.82 |
| Sarasota | 79.5 | +2.2 | 9.76 | +7.00 |
| Melbourne | 78.6 | +2.3 | 13.38 | +8.52 |
| Fort Myers | 79.7 | +1.7 | 1.21 | -1.87 |
| West Palm Beach | 80.5 | +1.8 | 10.89 | +4.99 |
Appendix 2
Select daily record high maximum temperatures tied or broken during October (compiled from NOAA).
| Station | Date | Record (˚F) | Broken/Tied | Last |
| Fort Lauderdale Beach | 1 | 97 | Broken | 93 in 2024 |
| Gainesville | 1 | 92 | Tied | 92 in 2019 |
| Kissimmee | 3 | 93 | Tied | 93 in 1971 |
| Orlando | 4 | 94 | Tied | 94 in 1986 |
| Clermont | 5 | 95 | Tied | 95 in 2024 |
| Fort Lauderdale Beach | 5 | 102 | Broken | 91 in 2015 |
| Lakeland | 9 | 93 | Broken | 92 in 2018 |
| Homestead | 10 | 96 | Broken | 93 in 2021 |
| Fort Lauderdale | 11 | 93 | Tied | 93 in 2018 |
| Vero Beach | 11 | 93 | Broken | 92 in 2020 |
| Clermont | 12 | 94 | Broken | 93 in 2020 |
| Fort Lauderdale Beach | 13 | 104 | Broken | 93 in 2023 |
| Tallahassee | 13 | 90 | Tied | 90 in 2020 |
| Chipley | 14 | 91 | Broken | 90 in 2017 |
| Homestead | 15 | 95 | Broken | 91 in 2022 |
| Venice | 15 | 93 | Broken | 92 in 2019 |
| Clermont | 17 | 95 | Tied | 95 in 2018 |
| Homestead | 17 | 95 | Broken | 92 in 2019 |
| Fort Lauderdale Beach | 30 | 99 | Broken | 89 in 2025 |