Prepared by Florida Climate Center
Florida State University
Tallahassee, FL

Summary:
- Monthly average temperatures in September were near normal in South Florida and above normal in northern Florida.
- Monthly precipitation totals in September were generally below normal in northern Florida and above normal in parts of central and south Florida.
- At the end of September, nearly 2% of the state was in extreme drought (D3), 11% was in severe drought (D2), 40% in moderate drought (D1), and 36% was abnormally dry (D0), while 11% of the state was drought free, according to the U.S. Drought Monitor.
- El Niño continued to strengthen in the tropical equatorial Pacific Ocean. There is currently a 75% chance of a historic event during the October-December 2026 period that would exceed the strength of previous El Niño events. This greatly increases the odds for a wetter than average winter in Florida.
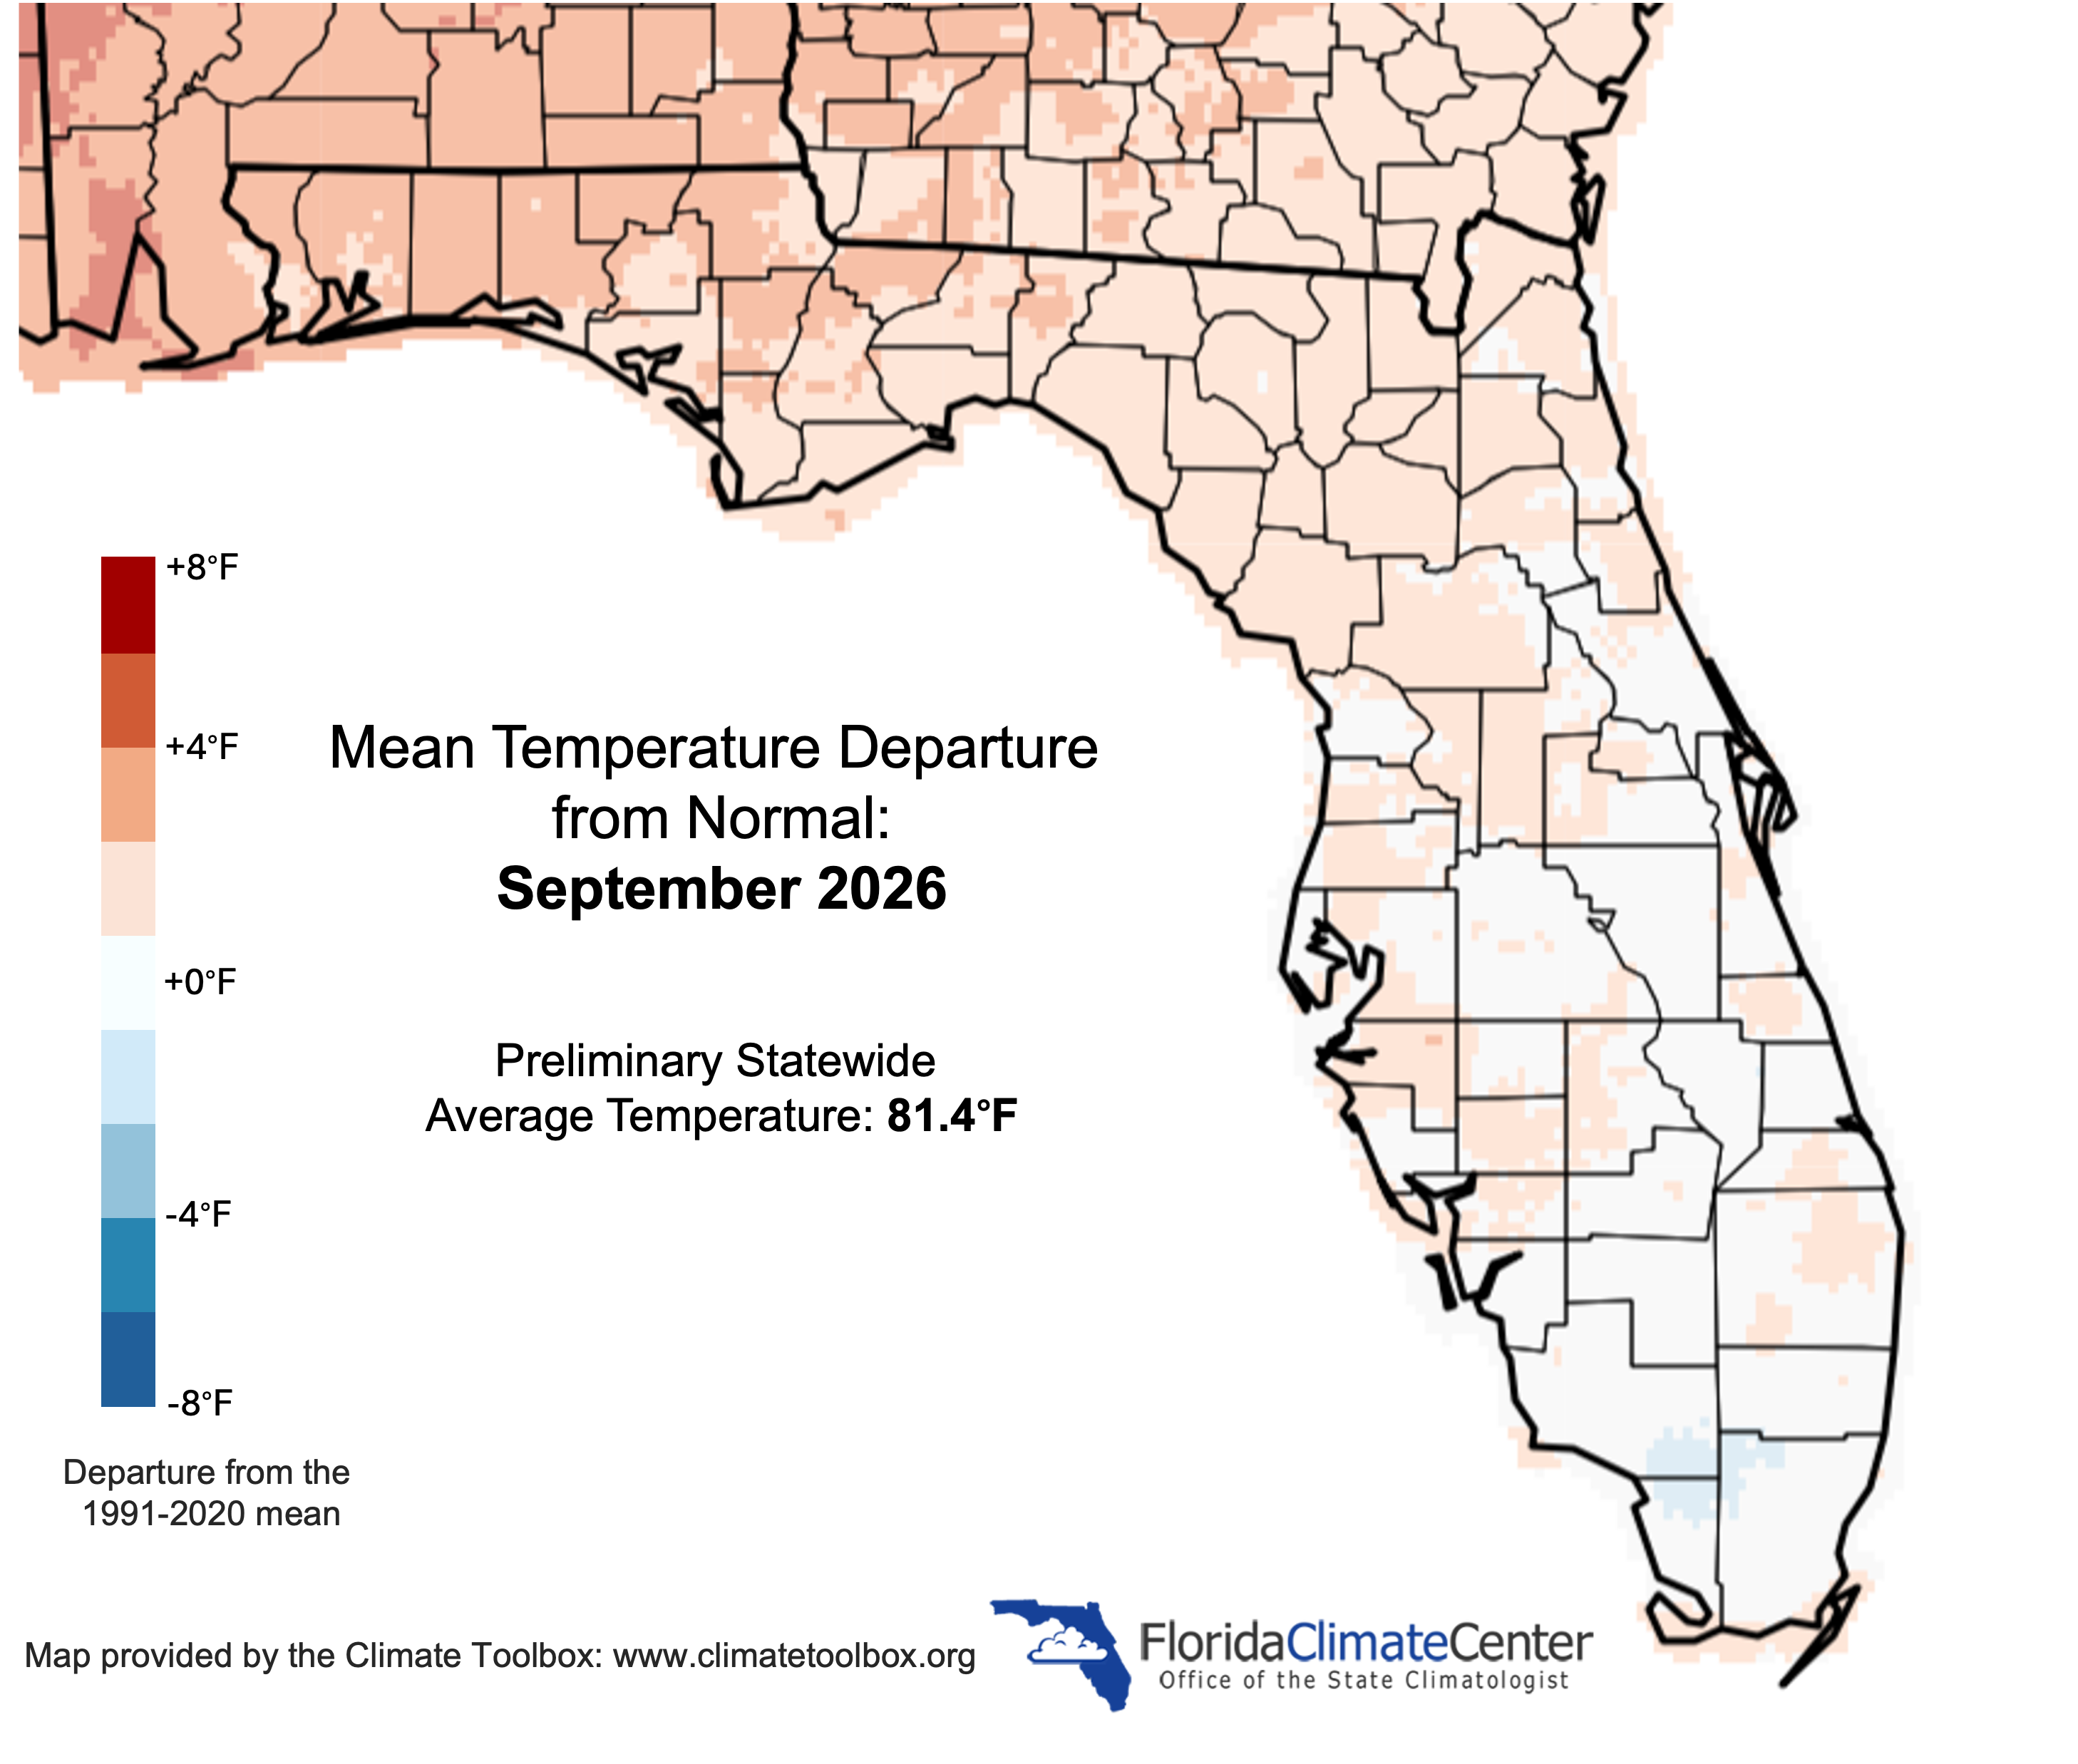
Monthly average temperatures in September were near normal in South Florida and above normal in northern Florida. Average monthly temperature departures from normal ranged from -0.1 ̊F in Tampa and West Palm Beach to +1.9 ̊F in Tallahassee (see Table 1 and Appendix 1 for select cities). The month began with warmer than normal temperatures, but a cold front ushered in more fall-like weather during the last week of the month with a cooler and drier airmass being felt statewide. Temperatures during the last week of the month fell below normal in most places, with particularly cooler nighttime temperatures. Low temperatures dipped down to 55 ̊F in Jacksonville on the 26th and in Tallahassee on the 26th and 28th. Gainesville recorded a low temperature of 54 ̊F on the 26th and 27th, representing new daily record lows (the 27th was tied), and Hastings dipped to 50 ̊F on the 28th, which was also a new record daily low. Record daily lows of 64 ̊F were tied on September 28 at Vero Beach (previously set in 2021) and Fort Pierce (previously set in 2021 and 1991). Select daily record high minimum temperatures tied or broken during September are provided in Appendix 2.
Table 1. September average temperatures and departures from normal ( ̊F) for select cities.
| Station | Mean Temperature | Departure from Normal |
| Pensacola | 81.4 | +1.4 |
| Tallahassee | 81.0 | +1.9 |
| Jacksonville | 79.6 | +0.8 |
| Orlando | 82.1 | +1.1 |
| Tampa | 82.6 | -0.1 |
| Miami | 83.1 | +0.1 |
| Key West | 84.1 | 0.0 |
Figure 1. Monthly average temperature departures from normal (°F) in Florida for September 2026.
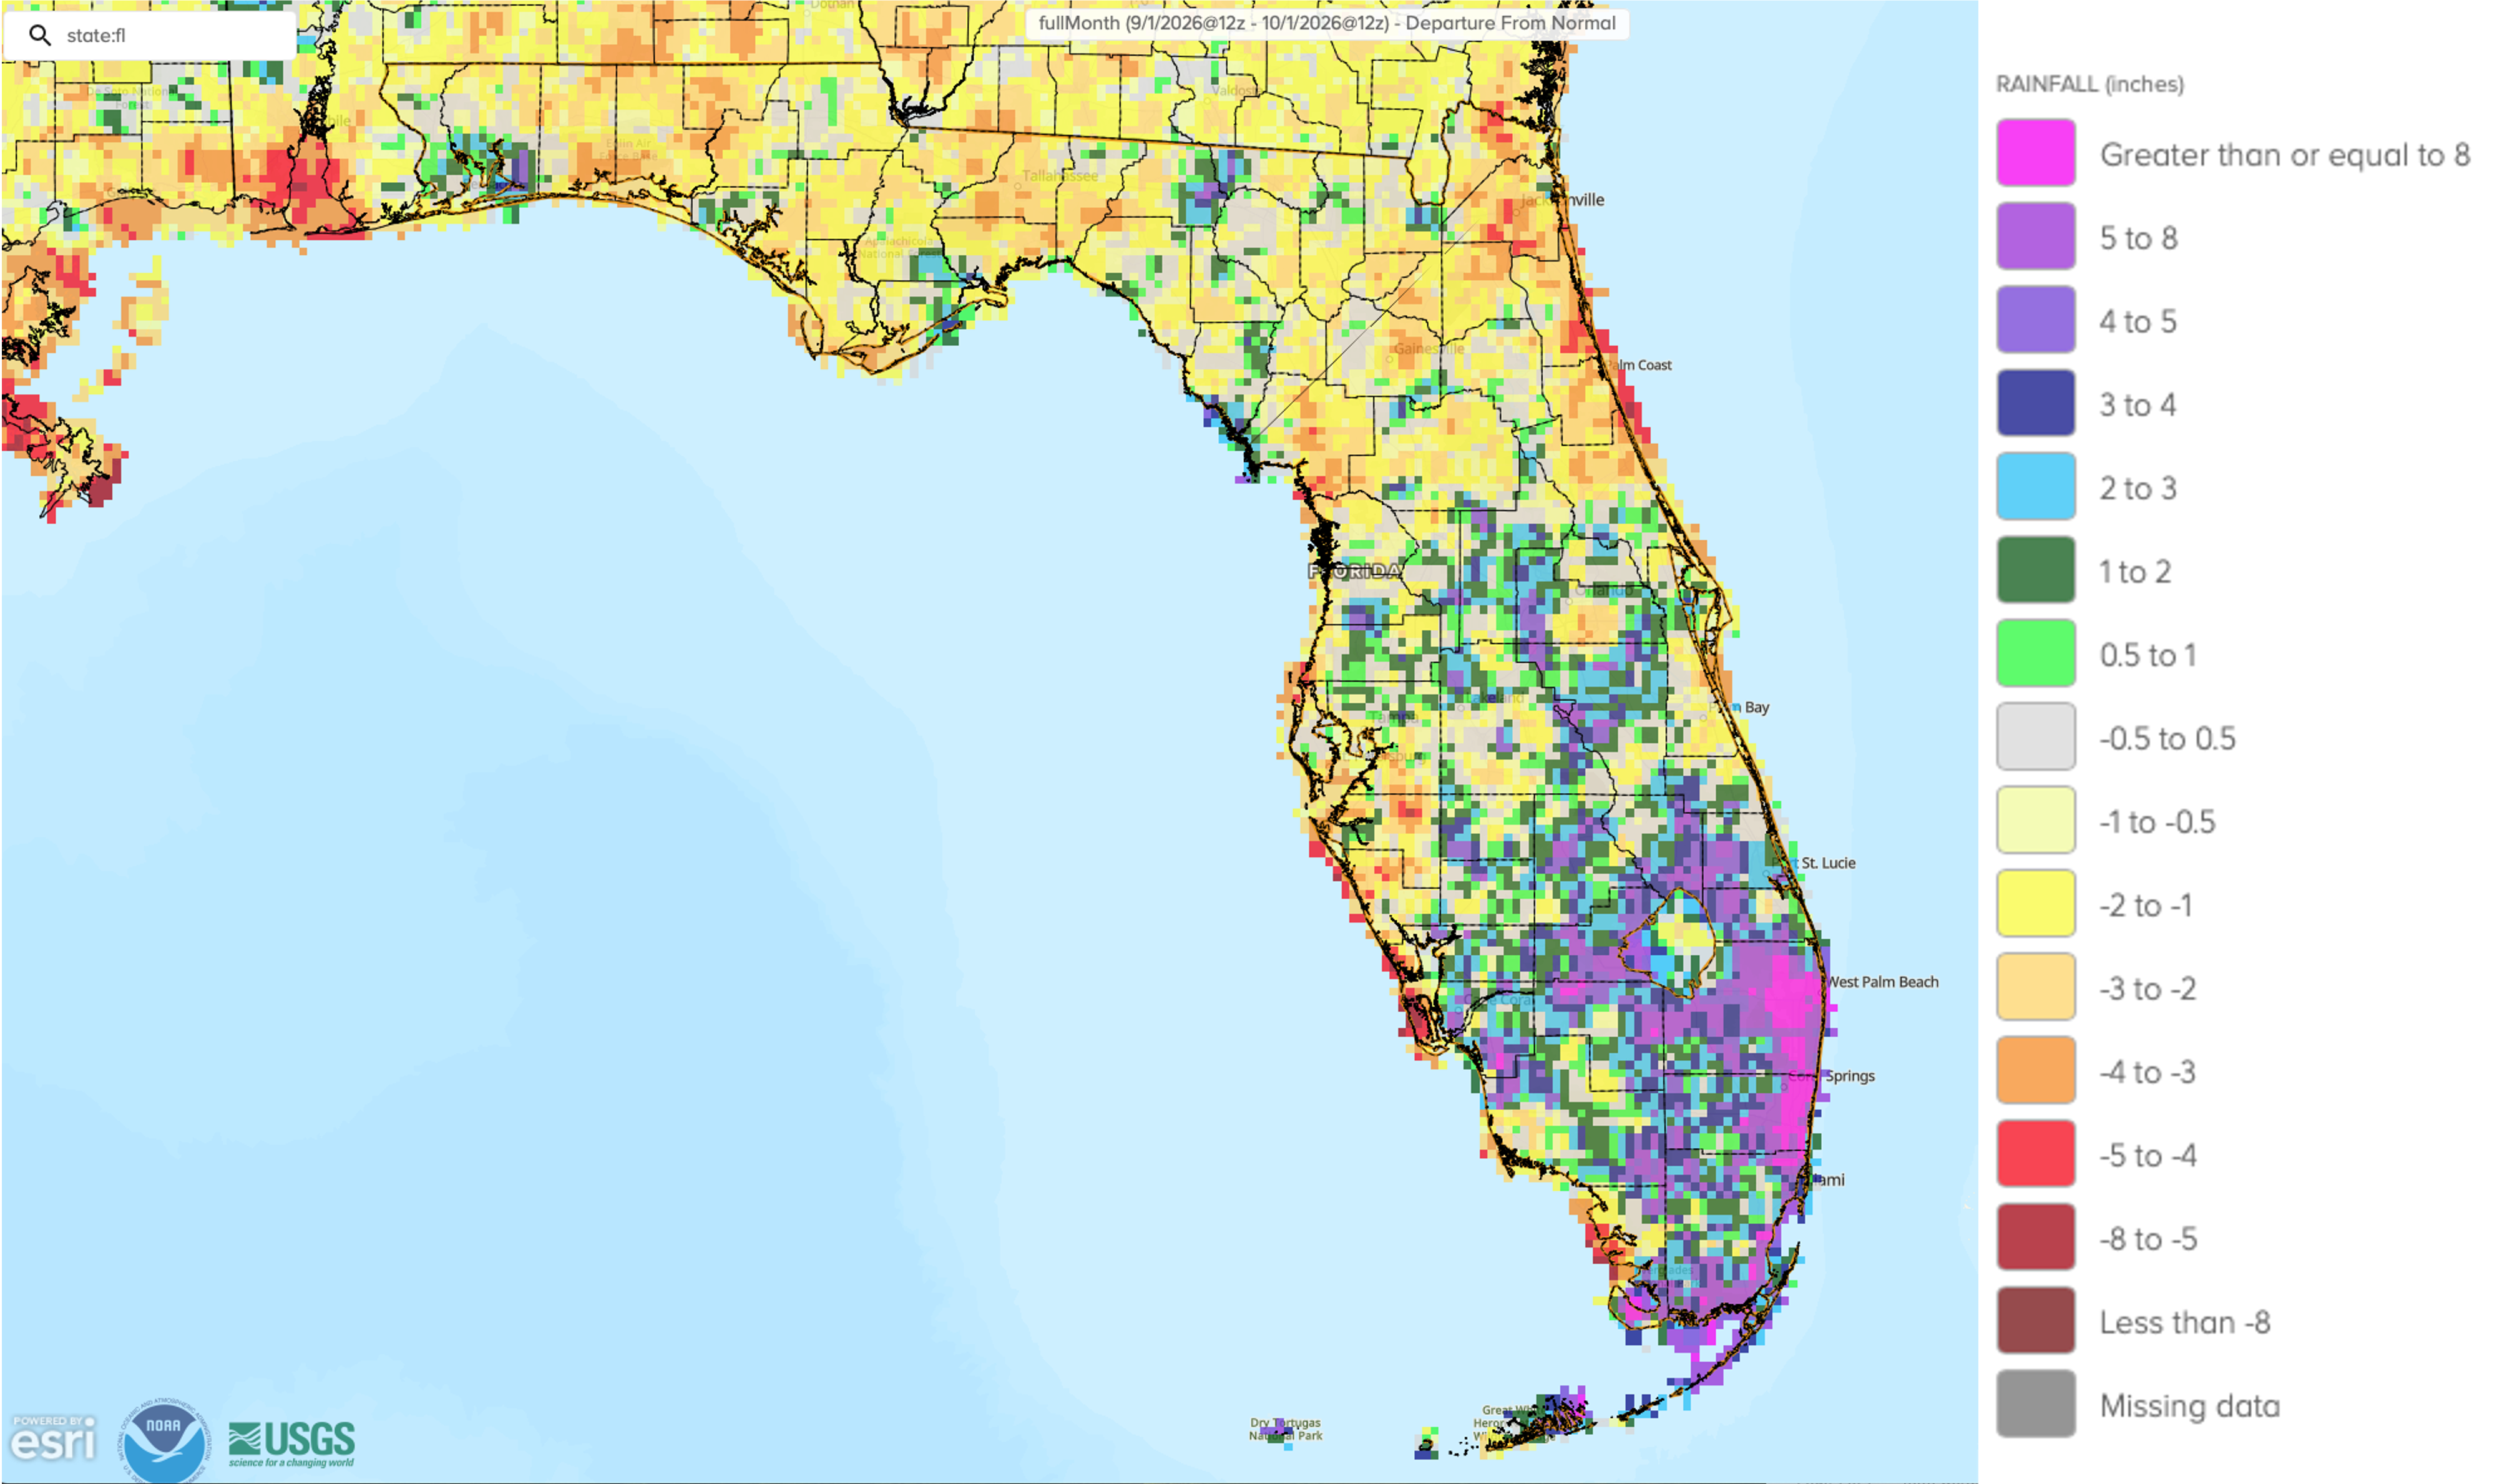
Monthly precipitation totals in September were generally below normal in northern Florida and above normal in parts of central and south Florida. The monthly precipitation departures from normal ranged from -5.05 inches in Daytona Beach to +14.32 inches in Fort Lauderdale (see Table 2 and Appendix 1 for select locations). Gainesville tied for its 3rd-driest September on record with a monthly rainfall total of only 0.93 inches, which was -4.12 inches below normal (136 years). Jacksonville Beach recorded its 10th-driest September on record (76 years), and both Orlando and Daytona Beach had their 7th-driest September on record (72 and 90 years, respectively). Following a record dry summer (JJA), Fort Lauderdale registered its wettest September on record (105 years) with a total monthly rainfall of 22.34 inches, which is +14.32 inches above normal for the month.
Table 2. September precipitation totals and departures from normal (inches) for selected cities.
| Station | Total Rainfall | Departure from Normal |
| Pensacola | 6.78 | +0.17 |
| Tallahassee | 2.09 | -2.82 |
| Jacksonville | 4.29 | -3.27 |
| Orlando | 2.57 | -3.80 |
| Tampa | 5.00 | -1.09 |
| Miami | 7.31 | -2.91 |
| Key West | 8.11 | +0.87 |
Figure 2. A graphical depiction of the monthly rainfall departure from normal (inches) for September 2026 (courtesy of NOAA, NWS).
El Niño Advisory Continues in the Pacific Ocean.
El Niño continued to strengthen in the tropical equatorial Pacific Ocean over the past month and there is a greater than 90% chance of a very strong event during fall and winter of 2026-2027. Sea surface temperature anomalies in the eastern equatorial Pacific have reached +3.0°C and subsurface temperature anomalies were in excess of 10°C at depth. The coupled ocean-atmosphere system continues to reflect conditions consistent with a robust and strengthening El Niño. During the October-December 2026 period, there is now a 75% chance of a historic event that would exceed the strength of all previous El Niño events dating back to 1950. A very strong El Niño considerably increases the odds of experiencing impacts consistent with El Niño, which means above average winter precipitation in Florida, particularly December through February, as well as an increased risk for severe weather. Read more about what a very strong El Niño will mean for Florida.
Hazardous Weather Events in September.
According to the Local Storm Reports issued by the local National Weather Service offices serving Florida, there were 199 individual local reports of hazardous weather events recorded across the state during the month of September (see Table 3 for a breakdown by event type). Strong thunderstorms led to multiple reports of damages mainly due to strong wind gusts and heavy rainfall. Lightning led to one injury and one fatality during the month, and lightning downed trees and was thought to be responsible for a structure fire that occurred in Pinellas County on the 8th. Coastal high-tide flooding was reported in Fort Lauderdale and Miami Beach and at Palm Coast in Flagler County during the last week of the month, where tidal flooding coincided with high tide leading to inundated roadways and flooding at the Fort Lauderdale International Airport. High surf caused one fatality on the 27th.
Table 3. Breakdown of storm reports submitted in Florida during the month of September (compiled from Iowa State University/Iowa Environmental Mesonet).
| Report Type | Number of Reports |
| Heavy Rain | 18 |
| Flood | 16 |
| Flash Flood | 2 |
| Hail | 3 |
| Lightning | 4 |
| Marine Thunderstorm Wind | 39 |
| Non-Thunderstorm Wind Gust | 2 |
| Tornado/Landspout/Waterspout/Funnel Cloud | 1 / 3 / 17 / 5 |
| Thunderstorm Wind Damage | 20 |
| Non-Thunderstorm Wind Damage | 0 |
| Thunderstorm Wind Gust | 54 |
| Wildfire | 2 |
| Rip Currents | 1 |
Daily Record Events in September.
Table 4. Summary of daily records broken, or set, in Florida in September 2026 (source: NCEI Daily Weather Records).
| Category | Number of Records |
| Highest daily max. temp. | 19 |
| Highest daily min. temp. | 34 |
| Lowest daily max. temp. | 6 |
| Lowest daily min. temp. | 12 |
| Highest daily precipitation | 9 |
| Total | 80 |
Drought-Related Impacts.
Monthly precipitation totals were below normal in northern Florida and above normal in much of southern Florida. Precipitation along the southeastern coast was well above normal, with surpluses greater than 8 inches. Overall, this led to drought improvements across much of the Peninsula during the month, with South Florida seeing between a one and three category improvement over the last 4 weeks. Drought degraded in parts of the Panhandle and central Florida. As of September 15th, approximately 2% of the state was in extreme drought (D3), 12% in severe drought (D2), 41% was in moderate drought (D1), and 36% was abnormally dry (D0), according to the U.S. Drought Monitor. By the end of the month, 1.8% of the state remained in extreme drought (D3), 11% was in severe drought (D2), 40% was in moderate drought (D1), and 36% of the state was abnormally dry (D0) (Figure 3 below).
As of September 30, the Lake Okeechobee water level was 11.88 ft. above sea level (Feet-NGVD29), which is below average and below the water shortage management level of about 13.00 feet for this time of year. At the first of September, the water level was 10.98 ft. above sea level.
Figure 3. A graphical depiction of the latest drought conditions in Florida according to the U.S. Drought Monitor (courtesy of the National Drought Mitigation Center, University of Nebraska-Lincoln).

Agriculture-Related Impacts.
In mid-September, topsoil moisture conditions were adequate in 72% of the state, short in 7%, and very short in 2% of the state, while 19% had surplus topsoil moisture conditions. By the end of September, topsoil moisture conditions were adequate in 67% of the state, short in 19%, and very short in 6% of the state, while 8% of the state had surplus topsoil conditions. For more information, consult the Crop Progress and Conditions report, which are published by the USDA’s National Agricultural Statistics Service.
Appendix 1
Additional September departures from normal data for select Florida locations (source: NWS).
| Station | Average Temperature (˚F) | Departure from Normal (˚F) | Total Rainfall (in.) | Departure from Normal (in.) |
| Gainesville | 79.6 | +0.8 | 0.93 | -4.12 |
| Sarasota | 83.1 | +0.9 | 11.83 | +5.83 |
| Melbourne | 81.0 | +0.4 | 6.57 | -1.06 |
| Fort Myers | 82.3 | +0.1 | 5.63 | -3.37 |
| West Palm Beach | 81.8 | -0.1 | 12.01 | +4.05 |
Appendix 2
Select daily record high maximum temperatures tied or broken during September (compiled from NOAA).
| Station | Date | Record (˚F) | Broken/Tied | Last |
| Daytona Beach | 2 | 79 | Broken | 78 in 2023 |
| Lakeland | 2 | 78 | Broken | 77 in 2020 |
| Clermont | 3 | 79 | Broken | 78 in 2020 |
| Tallahassee | 3 | 78 | Broken | 76 in 2024 |
| Tampa | 6 | 81 | Broken | 80 in 2022 |
| Bradenton | 7 | 79 | Broken | 78 in 2024 |
| Venice | 7 | 82 | Broken | 80 in 1989 |
| Lakeland | 7 | 78 | Broken | 77 in 2022 |
| Orlando | 14 | 78 | Tied | 78 in 2004 |
| Tampa | 14 | 79 | Tied | 79 in 2023 |
| Sanford | 15 | 79 | Broken | 77 in 2020 |
| Lakeland | 15 | 79 | Broken | 77 in 2020 |
| Daytona Beach | 16 | 80 | Tied | 80 in 2010 |
| Vero Beach | 16 | 80 | Tied | 80 in 2004 |
| Titusville | 17 | 79 | Broken | 78 in 2012 |
| Fort Lauderdale Beach | 19 | 82 | Broken | 81 in 2005 |
| Fort Lauderdale Beach | 20 | 82 | Broken | 81 in 2002 |
| Clermont | 23 | 77 | Broken | 76 in 1991 |
| Fort Lauderdale Beach | 26 | 86 | Broken | 82 in 1998 |
| Fort Lauderdale Beach | 28 | 86 | Broken | 82 in 2024 |