
Prepared by Florida Climate Center
Florida State University
Tallahassee, FL

Summary:
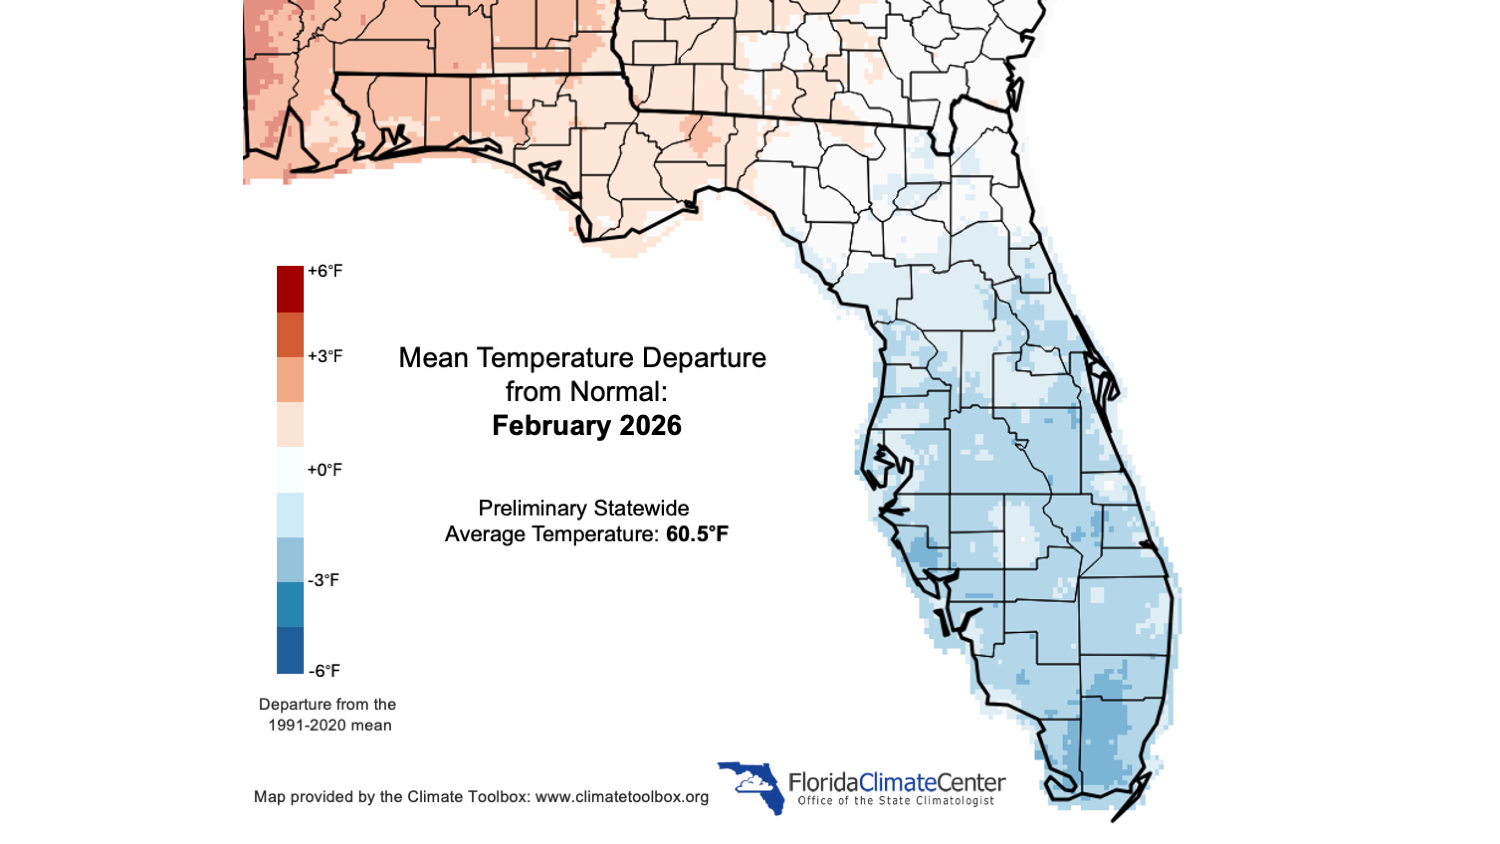
- Monthly mean temperatures in February were above normal in the Florida Panhandle and below normal in the Peninsula.
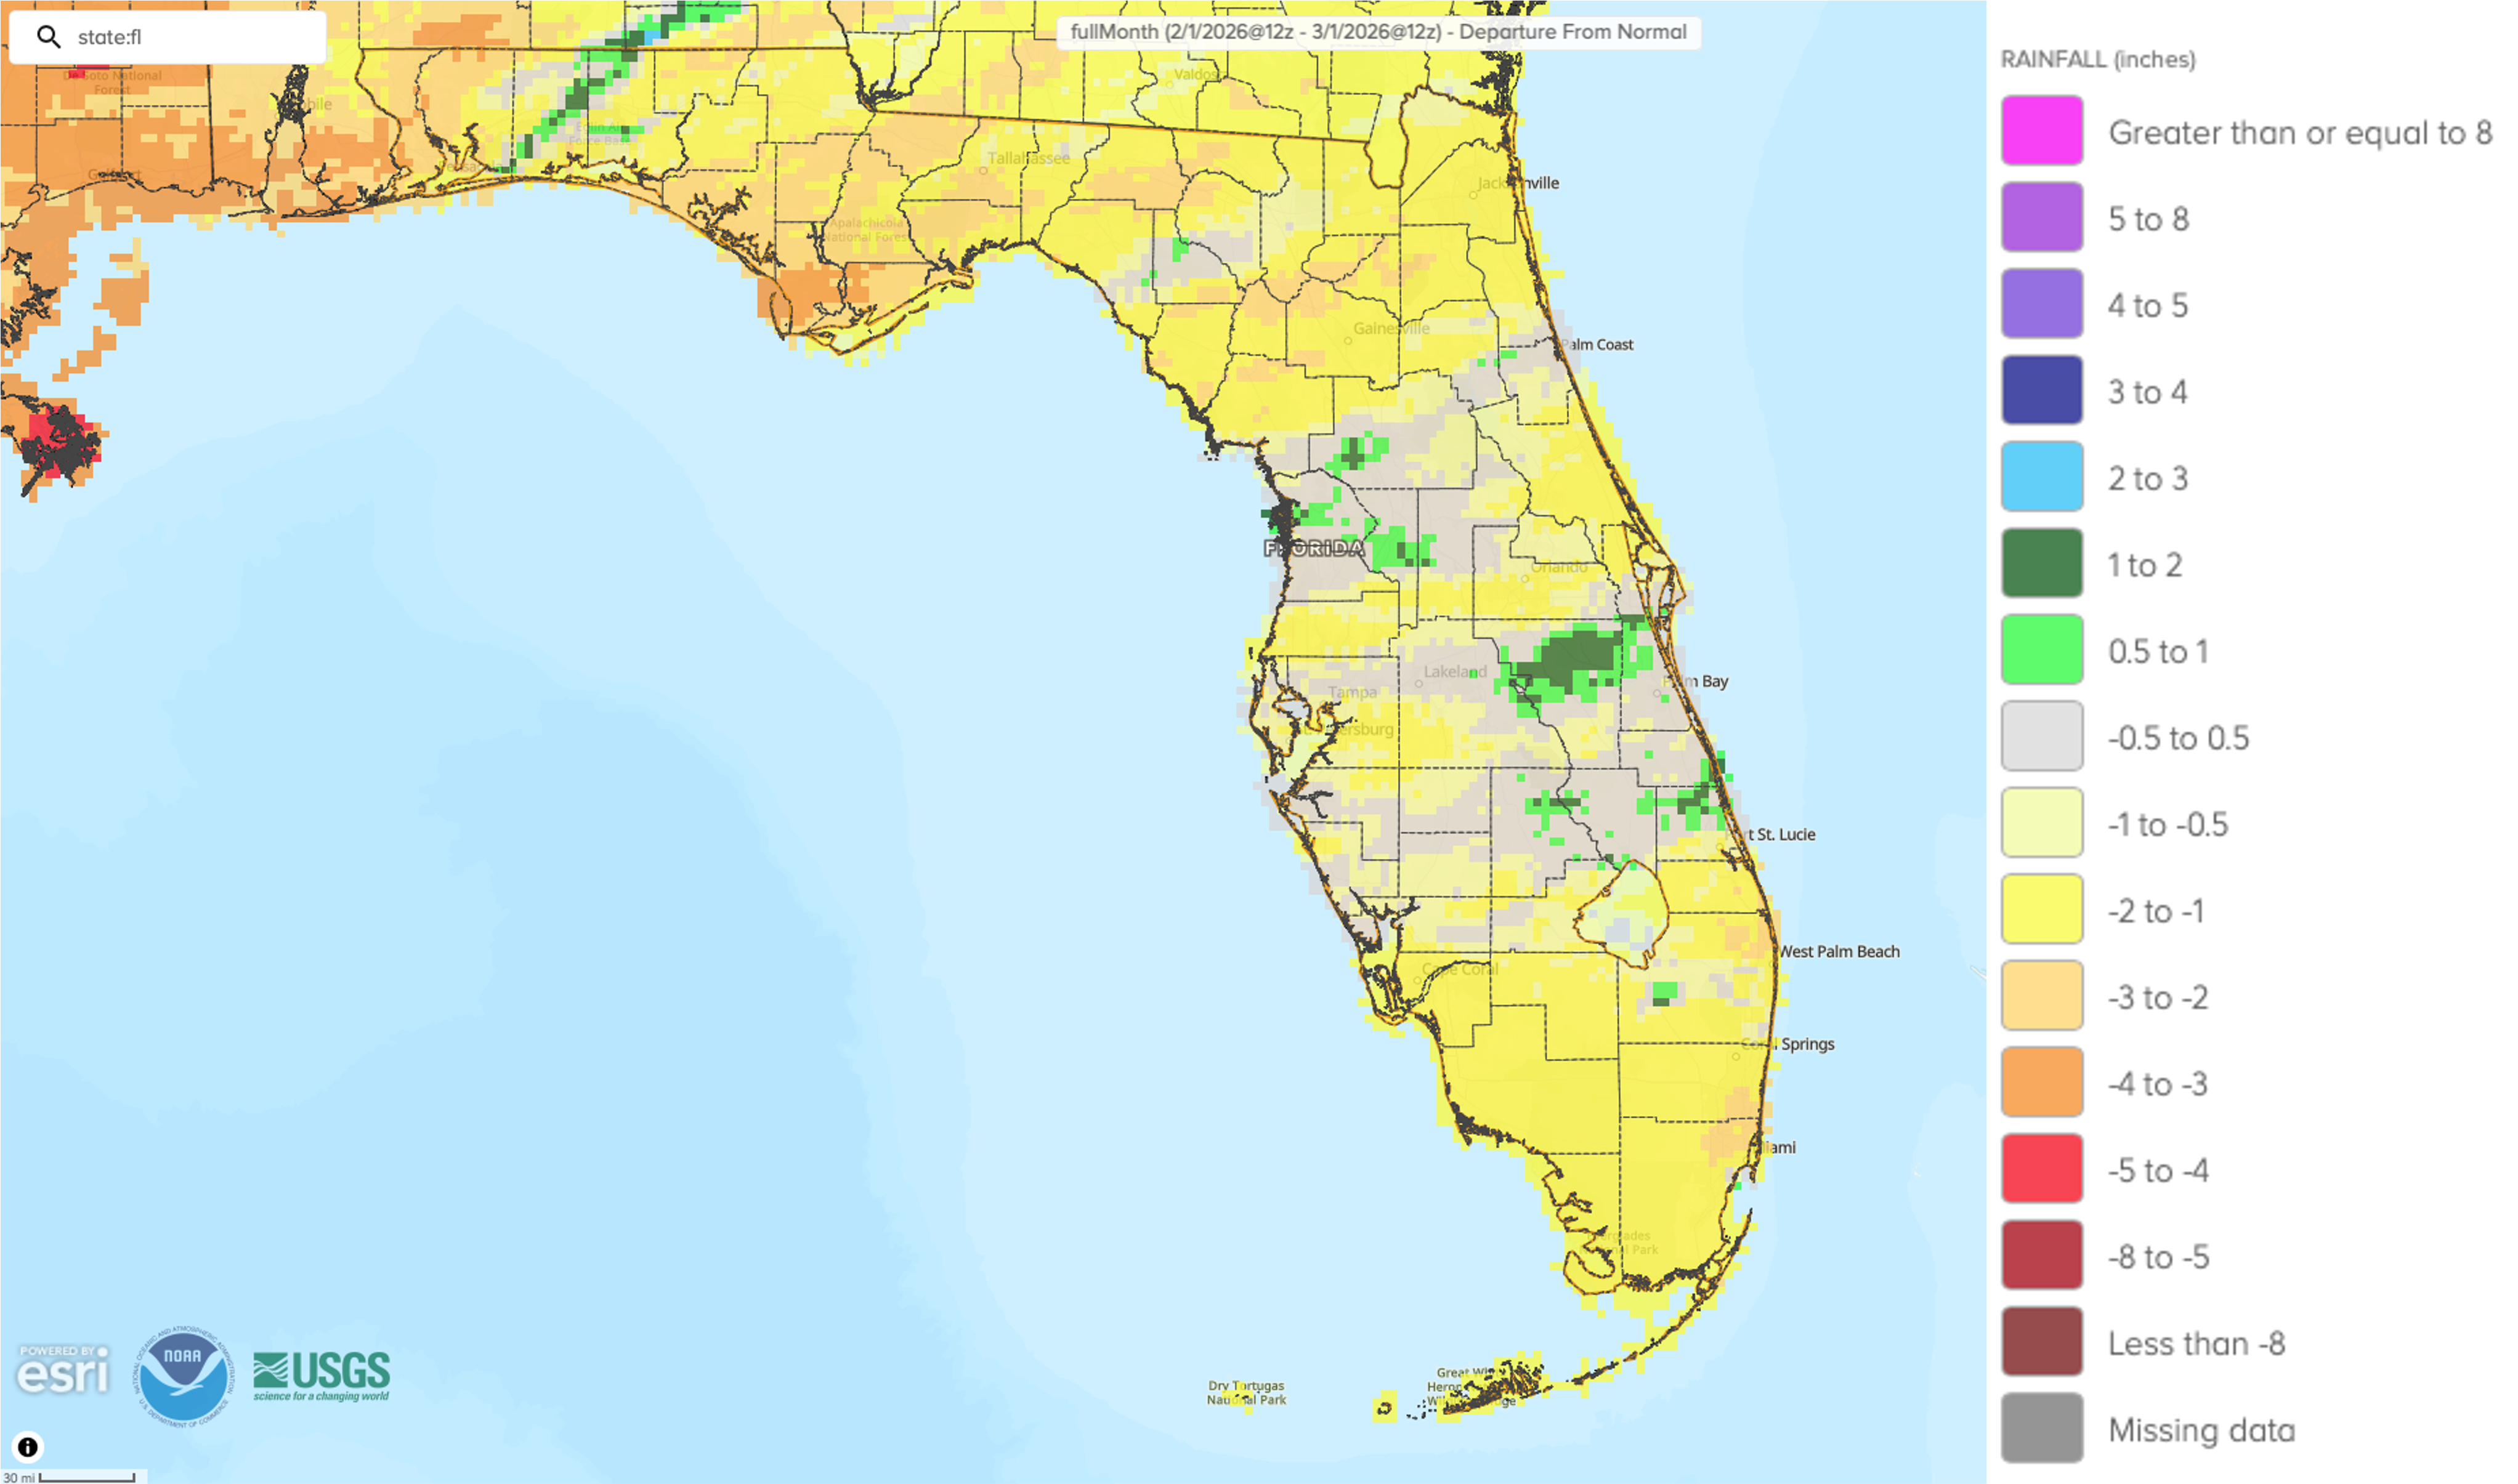
- Monthly precipitation totals in February were mostly below normal in Florida.
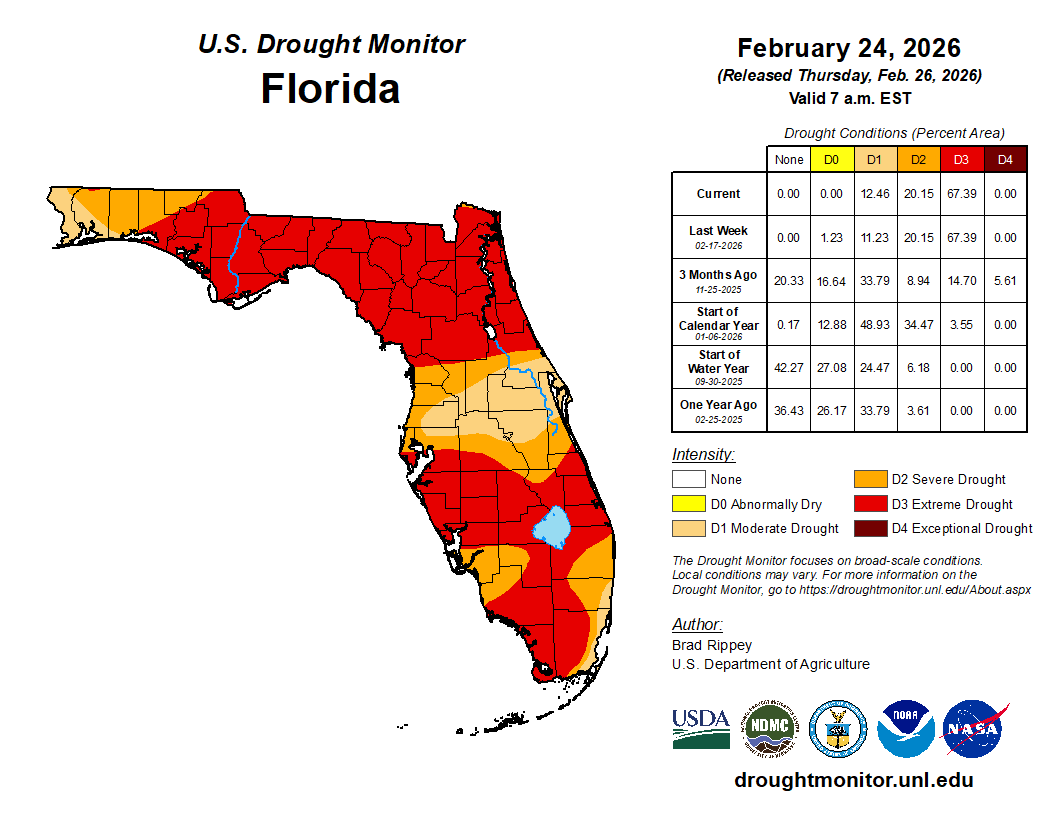
- Drought conditions persisted and extreme drought (D3) expanded across Florida during the month.
- A La Niña advisory continued during the past month with a transition to ENSO-neutral expected in February-April 2026 (60% chance).
Monthly average temperatures in February were above normal in the Florida Panhandle and below normal in the Peninsula. Average monthly temperature departures from normal ranged from -5.3 ̊F at the Archbold Bio Station (near Lake Placid) to +1.4 ̊F in Pensacola for the month (see Table 1 and Appendix 1 for select cities). The frigid weather in late January continued in early February, and it was the coldest, or 2nd-coldest, start to February on record across the Florida Peninsula. In addition, the period from January 27 to February 9 was the coldest or one of the top 5 coldest periods across Florida. Most places were impacted with at least 2-4 consecutive nights of hard freezes, including as far south as Port Charlotte and West Palm Beach. Tallahassee and Gainesville each saw 8 consecutive nights below 30 ̊F. Many new daily record low minimum temperatures were broken early in the month. The record cold start to the month was followed by a warmup mid month but another round of much below average temperatures impacted the state during the last week of February. Large temperature swings this winter resulted in near average mean temperatures for winter overall (Dec-Feb). Appendix 2 provides select daily record low temperatures tied or broken during the month.
Table 1. February average temperatures and departures from normal ( ̊F) for select cities.
| Station | Mean Temperature | Departure from Normal |
| Pensacola | 58.2 | +1.4 |
| Tallahassee | 56.1 | +0.5 |
| Jacksonville | 56.1 | -1.4 |
| Orlando | 60.4 | -3.2 |
| Tampa | 61.4 | -3.3 |
| Miami | 66.4 | -4.3 |
| Key West | 68.6 | -3.7 |
Figure 1. Monthly average temperature departures from normal (°F) in Florida for February 2026.
Monthly precipitation totals in February were mostly below normal. The monthly precipitation departures from normal ranged from -2.40 inches in Tallahassee to +0.24 inches in Sarasota (see Table 2 and Appendix 1 for select locations). February saw a continuation of below-average rainfall with widespread deficits of 1-2.5 inches and only isolated parts of central Florida registering near to above average rainfall for the month. Several locations experienced one of their top 10 driest months of February on record, including Jacksonville (3rd-driest based on 87 years), Miami (4th-driest based on 89 years), Clermont (5th-driest based on 66 years), and Ft. Lauderdale (6th-driest based on 87 years). Winter seasonal precipitation (DJF) had deficits on the order of 4-5 inches in the Panhandle, 2-3 inches in Central Florida, and 3-7 inches in South Florida. West Palm Beach tied for its 2nd-driest winter on record with 7.57 inches below average for the season (128 years); winter precipitation in Stuart was also 2nd-driest on record with 7.27 inches below average (66 years). The lack of rainfall over the past 6 months has led to very low streamflows in Florida.
Table 2. February precipitation totals and departures from normal (inches) for selected cities.
| Station | Total Rainfall | Departure from Normal |
| Pensacola | 3.26 | -1.51 |
| Tallahassee | 1.88 | -2.40 |
| Jacksonville | 0.67 | -2.19 |
| Orlando | 0.60 | -1.44 |
| Tampa | 2.04 | -0.58 |
| Miami | 0.08 | -2.07 |
| Key West | 0.09 | -1.45 |
Figure 2. A graphical depiction of the monthly rainfall departure from normal (inches) for February 2026 (courtesy of NOAA, NWS).
La Niña Advisory.
The tropical equatorial Pacific Ocean has remained in a La Niña state with below-average sea surface temperatures in the east-central region of the equatorial Pacific Ocean. Subsurface temperature anomalies increased with expanding above-average subsurface temperatures across the tropical Pacific Ocean. A transition to ENSO-neutral is favored in February-April 2026 (60% chance). ENSO-neutral is likely to continue through the Northern Hemisphere summer 2026 (56% chance in June-August 2026). The probability for an El Niño increases during late summer and beyond, with a 50-60% chance, though large uncertainty remains that far out.
Hazardous Weather Events in February.
According to the Local Storm Reports issued by the local National Weather Service offices serving Florida, there were 148 individual local reports of hazardous weather events recorded across the state during the month of February (see Table 3 for a breakdown by event type). Snow flurries were reported in the overnight hours of January 31st to February 1st in west-central and southwest Florida, including in Manatee, Sarasota, Hillsborough, Pinellas, Charlotte, and Lee Counties, but no accumulation occurred. Wildfires picked up during the month with continued dry conditions and gusty winds. During the first week of February, wildfires in Putnam County led to school and road closures. On the 2nd, bush fires broke out in Brevard County and a fire shut down a 7-mile stretch of I-95 in both directions due to low visibility but was quickly contained. On the 5th, a wildfire in Flagler County forced the evacuation of 25 residences and a building. Two wildfires broke out late during the month, one in western Broward County near I-75 and US 27 in the Everglades and another wildfire near the runway of the Homestead General Airport. The largest wildfire was the National Fire in the Big Cypress National Preserve in South Florida which had burned more than 35,000 acres, affected visibility in the region, and closed several roadways including a portion of I-75 known as Alligator Alley.
Table 3. Breakdown of storm reports submitted in Florida during the month of February (compiled from Iowa State University/Iowa Environmental Mesonet).
| Report Type | Number of Reports |
| Heavy Rain | 0 |
| Dense Fog | 0 |
| Hail | 9 |
| Marine Thunderstorm Wind | 24 |
| Non-Thunderstorm Wind Gust | 45 |
| Tornado/Waterspout/Funnel Cloud | 0 / 1 / 2 |
| Thunderstorm Wind Damage | 13 |
| Non-Thunderstorm Wind Damage | 2 |
| Thunderstorm Wind Gust | 20 |
| Wildfire | 22 |
| Snow Flurries | 10 |
Daily Record Events in February.
Table 4. Summary of daily records broken or set in Florida in February 2026 (source: NCEI Daily Weather Records).
| Category | Number of Records |
| Highest daily max. temp. | 59 |
| Highest daily min. temp. | 19 |
| Lowest daily max. temp. | 72 |
| Lowest daily min. temp. | 120 |
| Highest daily precipitation | 6 |
| Total | 276 |
Drought-Related Impacts.
By mid-month, drought continued to affect virtually all of Florida with 99% of the state in some level of drought (D1-D4). As of February 17, approximately 67% of the state was in extreme drought (D3), 20% was in severe drought (D2), and 11% was in moderate drought (D1); about 1% of the state was abnormally dry (D0), according to the U.S. Drought Monitor. By the end of the month, approximately 67% of the state was in extreme drought (D3), 20% was in severe drought (D2), and 12% was in moderate drought (D1); no areas were considered abnormally dry (D0) (Figure 2 below).
As of February 28, the Lake Okeechobee water level was 12.27 ft. above sea level (Feet-NGVD29), which is below average for this time of year. At the first of February, the water level was 12.72 ft. above sea level.
Figure 3. A graphical depiction of the latest drought conditions in Florida according to the U.S. Drought Monitor (courtesy of the National Drought Mitigation Center, University of Nebraska-Lincoln).
Agriculture-Related Impacts.
Following a dry fall and winter, concerns for spring crops are increasing for producers. At the end of February, the entire state was experiencing some level of drought conditions. The continuation of dry weather in most areas along with widespread hard freezes during the first part of the month impacted crop conditions. The hard freezes damaged strawberries, blueberries, sugarcane, citrus, and vegetable crops. The availability of water for freeze protection during the ongoing drought was a concern as well. Winter freezes overall have led to an estimated $3.2 billion in losses to Florida agriculture this season. Ongoing rainfall deficits impacted winter grazing and cover crops, and watermelon and rice planting were halfway completed by month’s end. Hay and supplemental feeding for livestock continued, though hay supplies were tight due to poor pasture quality due to months of dry, cold conditions. For more information, consult the Crop Progress - State Stories, which are published by the USDA’s National Agricultural Statistics Service each year from December – March.
Appendix 1
Additional February departures from normal data for select Florida locations (source: NWS).
| Station | Average Temperature (˚F) | Departure from Normal (˚F) | Total Rainfall (in.) | Departure from Normal (in.) |
| Gainesville | 55.9 | -2.5 | 0.87 | -1.80 |
| Sarasota | 61.7 | -3.1 | 2.16 | +0.24 |
| Melbourne | 60.3 | -3.7 | 2.06 | +0.08 |
| Fort Myers | 63.9 | -3.4 | 0.47 | -1.31 |
| West Palm Beach | 65.3 | -3.1 | 0.75 | -1.88 |
Appendix 2
Select daily record low minimum temperatures tied or broken during February (compiled from NOAA).
| Station | Date | Record (˚F) | Broken/Tied | Last |
| Apalachicola | 1 | 20 | Broken | 26 in 1977 |
| Daytona Beach | 1 | 23 | Broken | 31 in 1965 |
| Deland | 1 | 22 | Broken | 26 in 1936 |
| Fernandina Beach | 1 | 22 | Broken | 25 in 1936 |
| Inverness | 1 | 22 | Broken | 23 in 2022 |
| Lake City | 1 | 19 | Broken | 22 in 1909 |
| Lisbon | 1 | 23 | Broken | 30 in 1979 |
| Ocala | 1 | 20 | Broken | 24 in 1977 |
| Stuart | 1 | 28 | Broken | 36 in 1979 |
| Titusville | 1 | 25 | Broken | 30 in 1965 |
| Wauchula | 1 | 24 | Broken | 26 in 2022 |
| Marianna | 1 | 20 | Broken | 22 in 1951 |
| Orlando | 1 | 24 | Broken | 33 in 1979 |
| Gainesville | 1 | 20 | Broken | 28 in 1965 |
| Miami | 1 | 35 | Broken | 43 in 1979 |
| Tampa | 1 | 29 | Broken | 33 in 1965 |
| West Palm Beach | 1 | 30 | Broken | 38 in 1979 |
| Lakeland | 1 | 24 | Broken | 33 in 1979 |
| Jacksonville | 1 | 22 | Broken | 24 in 1977 |
| Fort Lauderdale | 2 | 34 | Broken | 38 in 1979 |
| Fort Pierce | 2 | 27 | Broken | 34 in 1980 |
| Homestead | 2 | 33 | Broken | 42 in 2003 |
| Kissimmee | 2 | 24 | Broken | 31 in 1980 |
| Lake City | 2 | 19 | Broken | 21 in 2005 |
| Melbourne | 2 | 26 | Broken | 33 in 1980 |
| Plant City | 2 | 26 | Tied | 26 in 1936 |
| Gainesville | 2 | 22 | Broken | 30 in 2013 |
| Vero Beach | 2 | 27 | Broken | 37 in 1951 |
| Tallahassee | 2 | 18 | Broken | 19 in 1951 |
| Melbourne | 3 | 29 | Broken | 35 in 1979 |
| Orlando | 3 | 30 | Broken | 33 in 1976 |
| Marianna | 24 | 26 | Broken | 31 in 2002 |
| Gainesville | 24 | 25 | Tied | 25 in 1989 |
| Crestview | 24 | 24 | Tied | 24 in 1978 |
| Fort Lauderdale | 25 | 44 | Broken | 49 in 2010 |
| Usher Tower | 25 | 22 | Broken | 24 in 1989 |