
Prepared by Florida Climate Center
Florida State University
Tallahassee, FL

Summary:
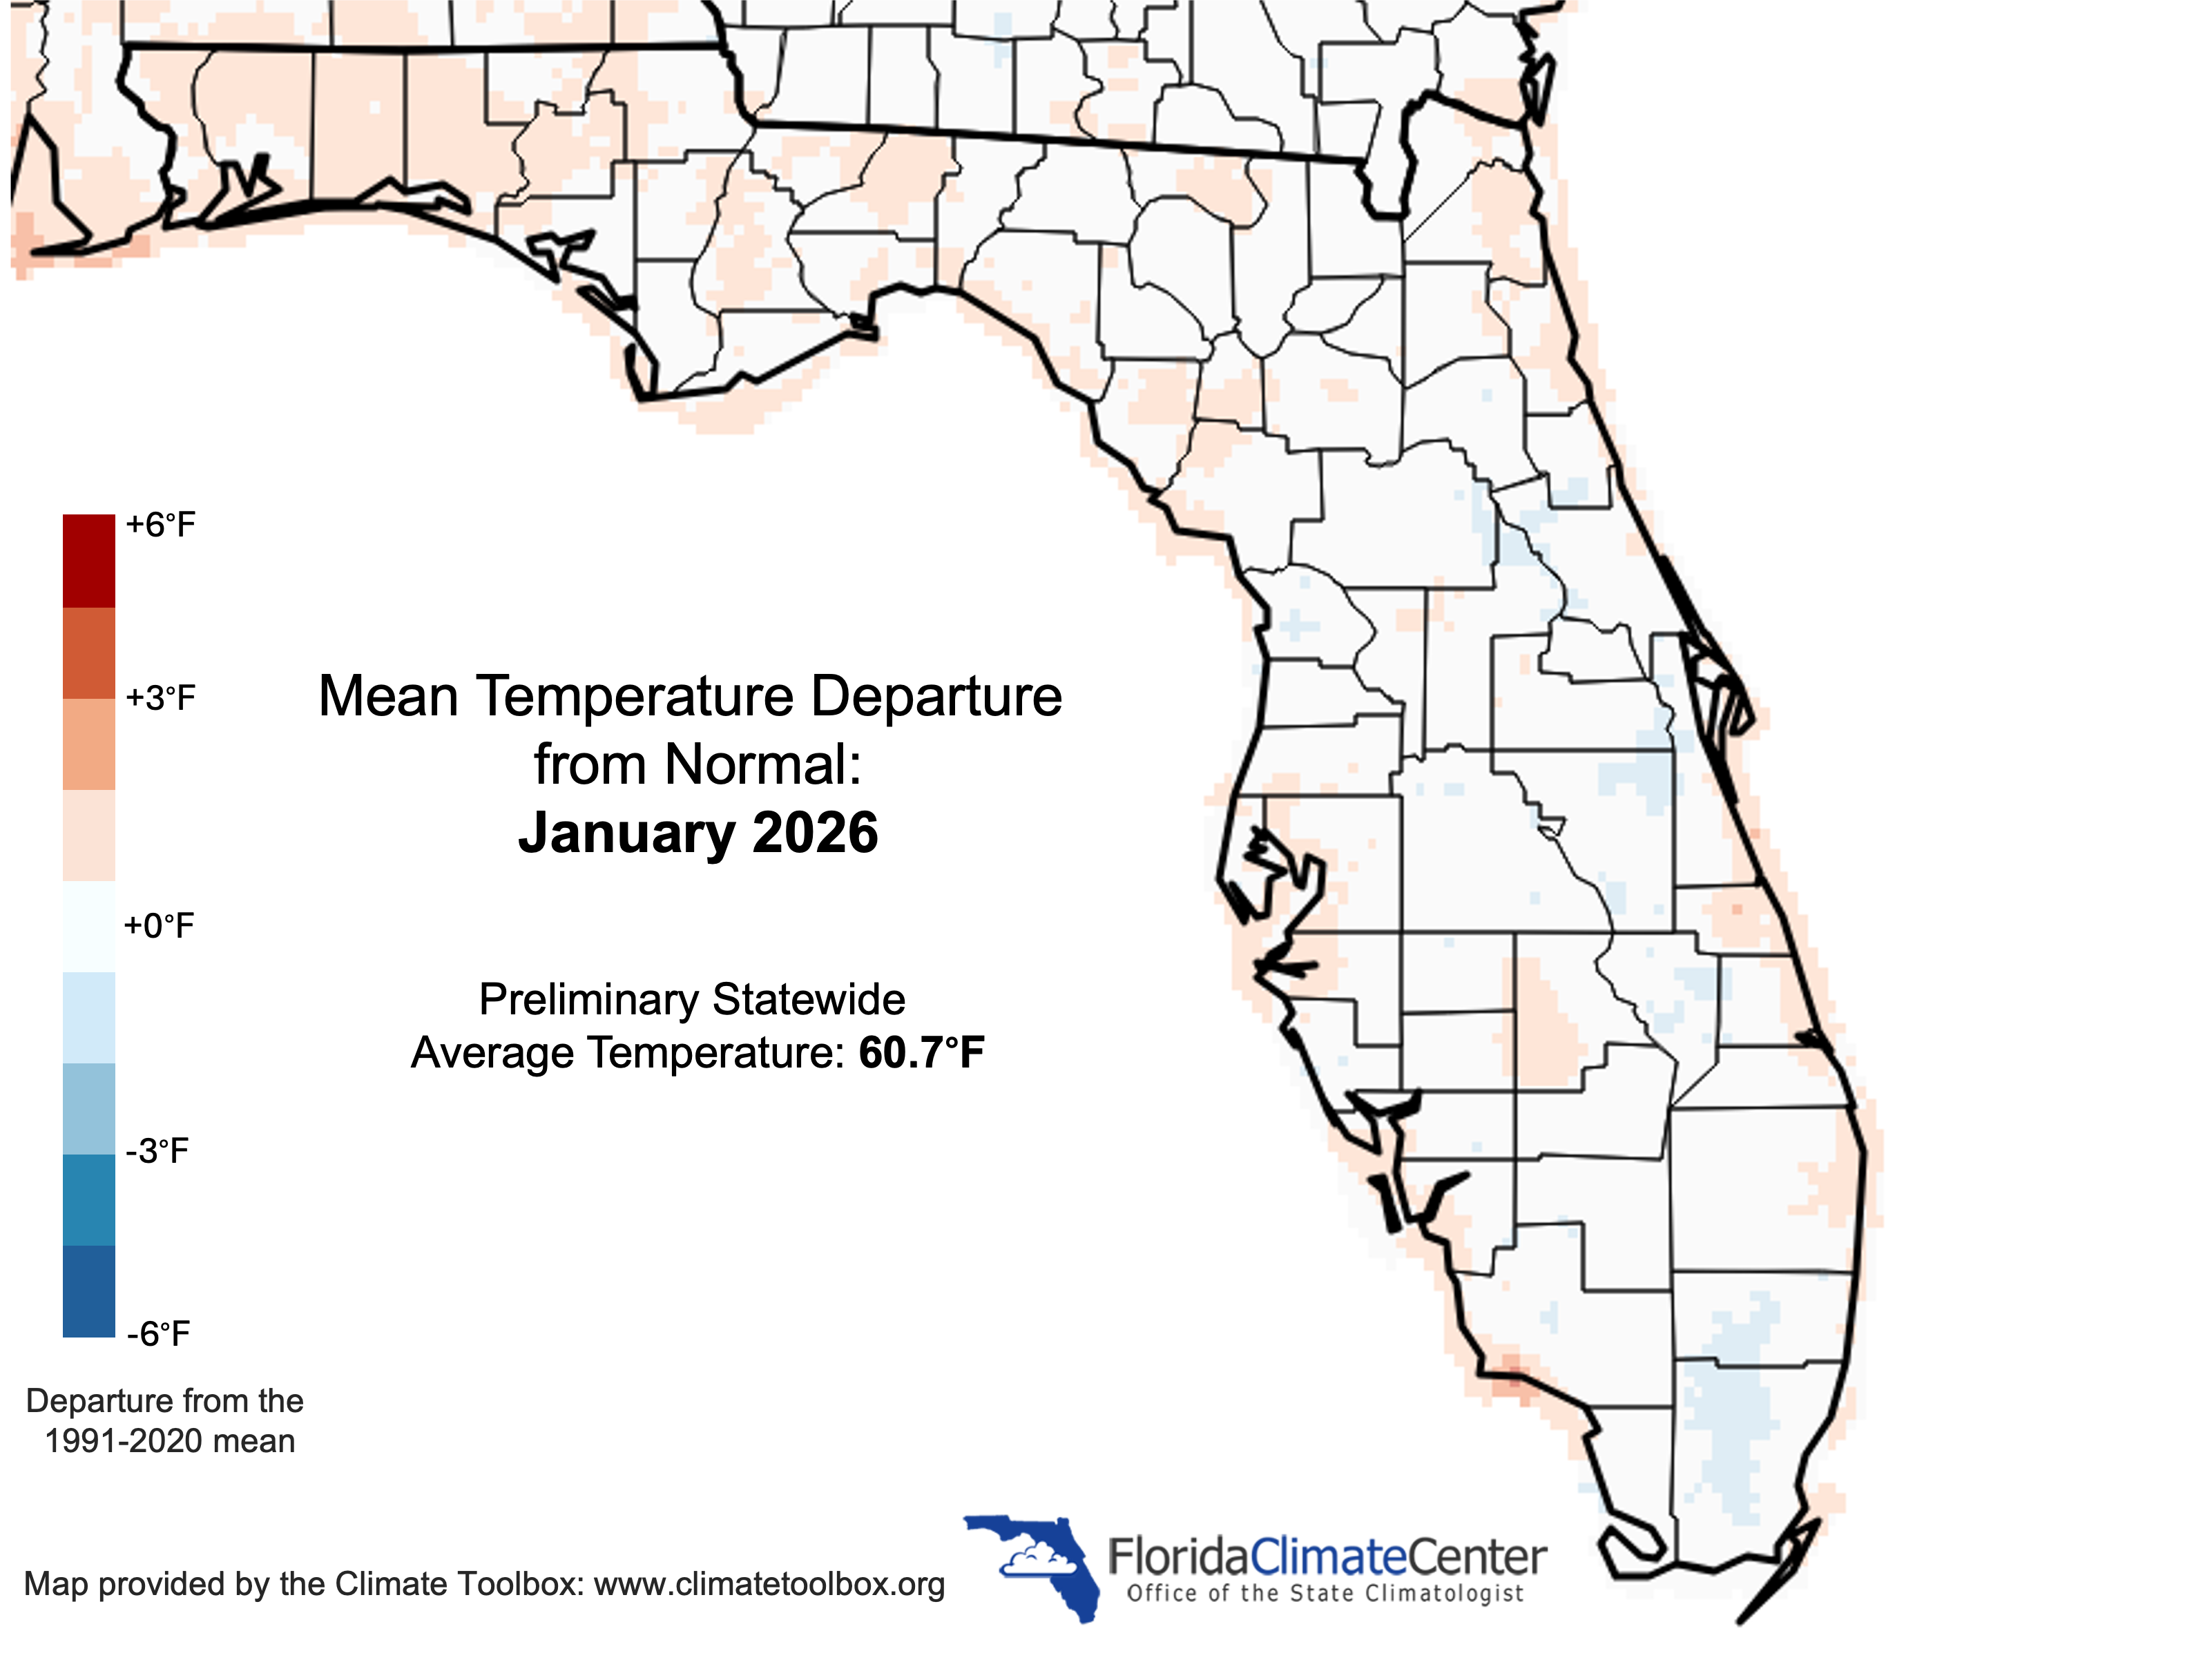
- Monthly mean temperatures in January averaged out to near normal across Florida.
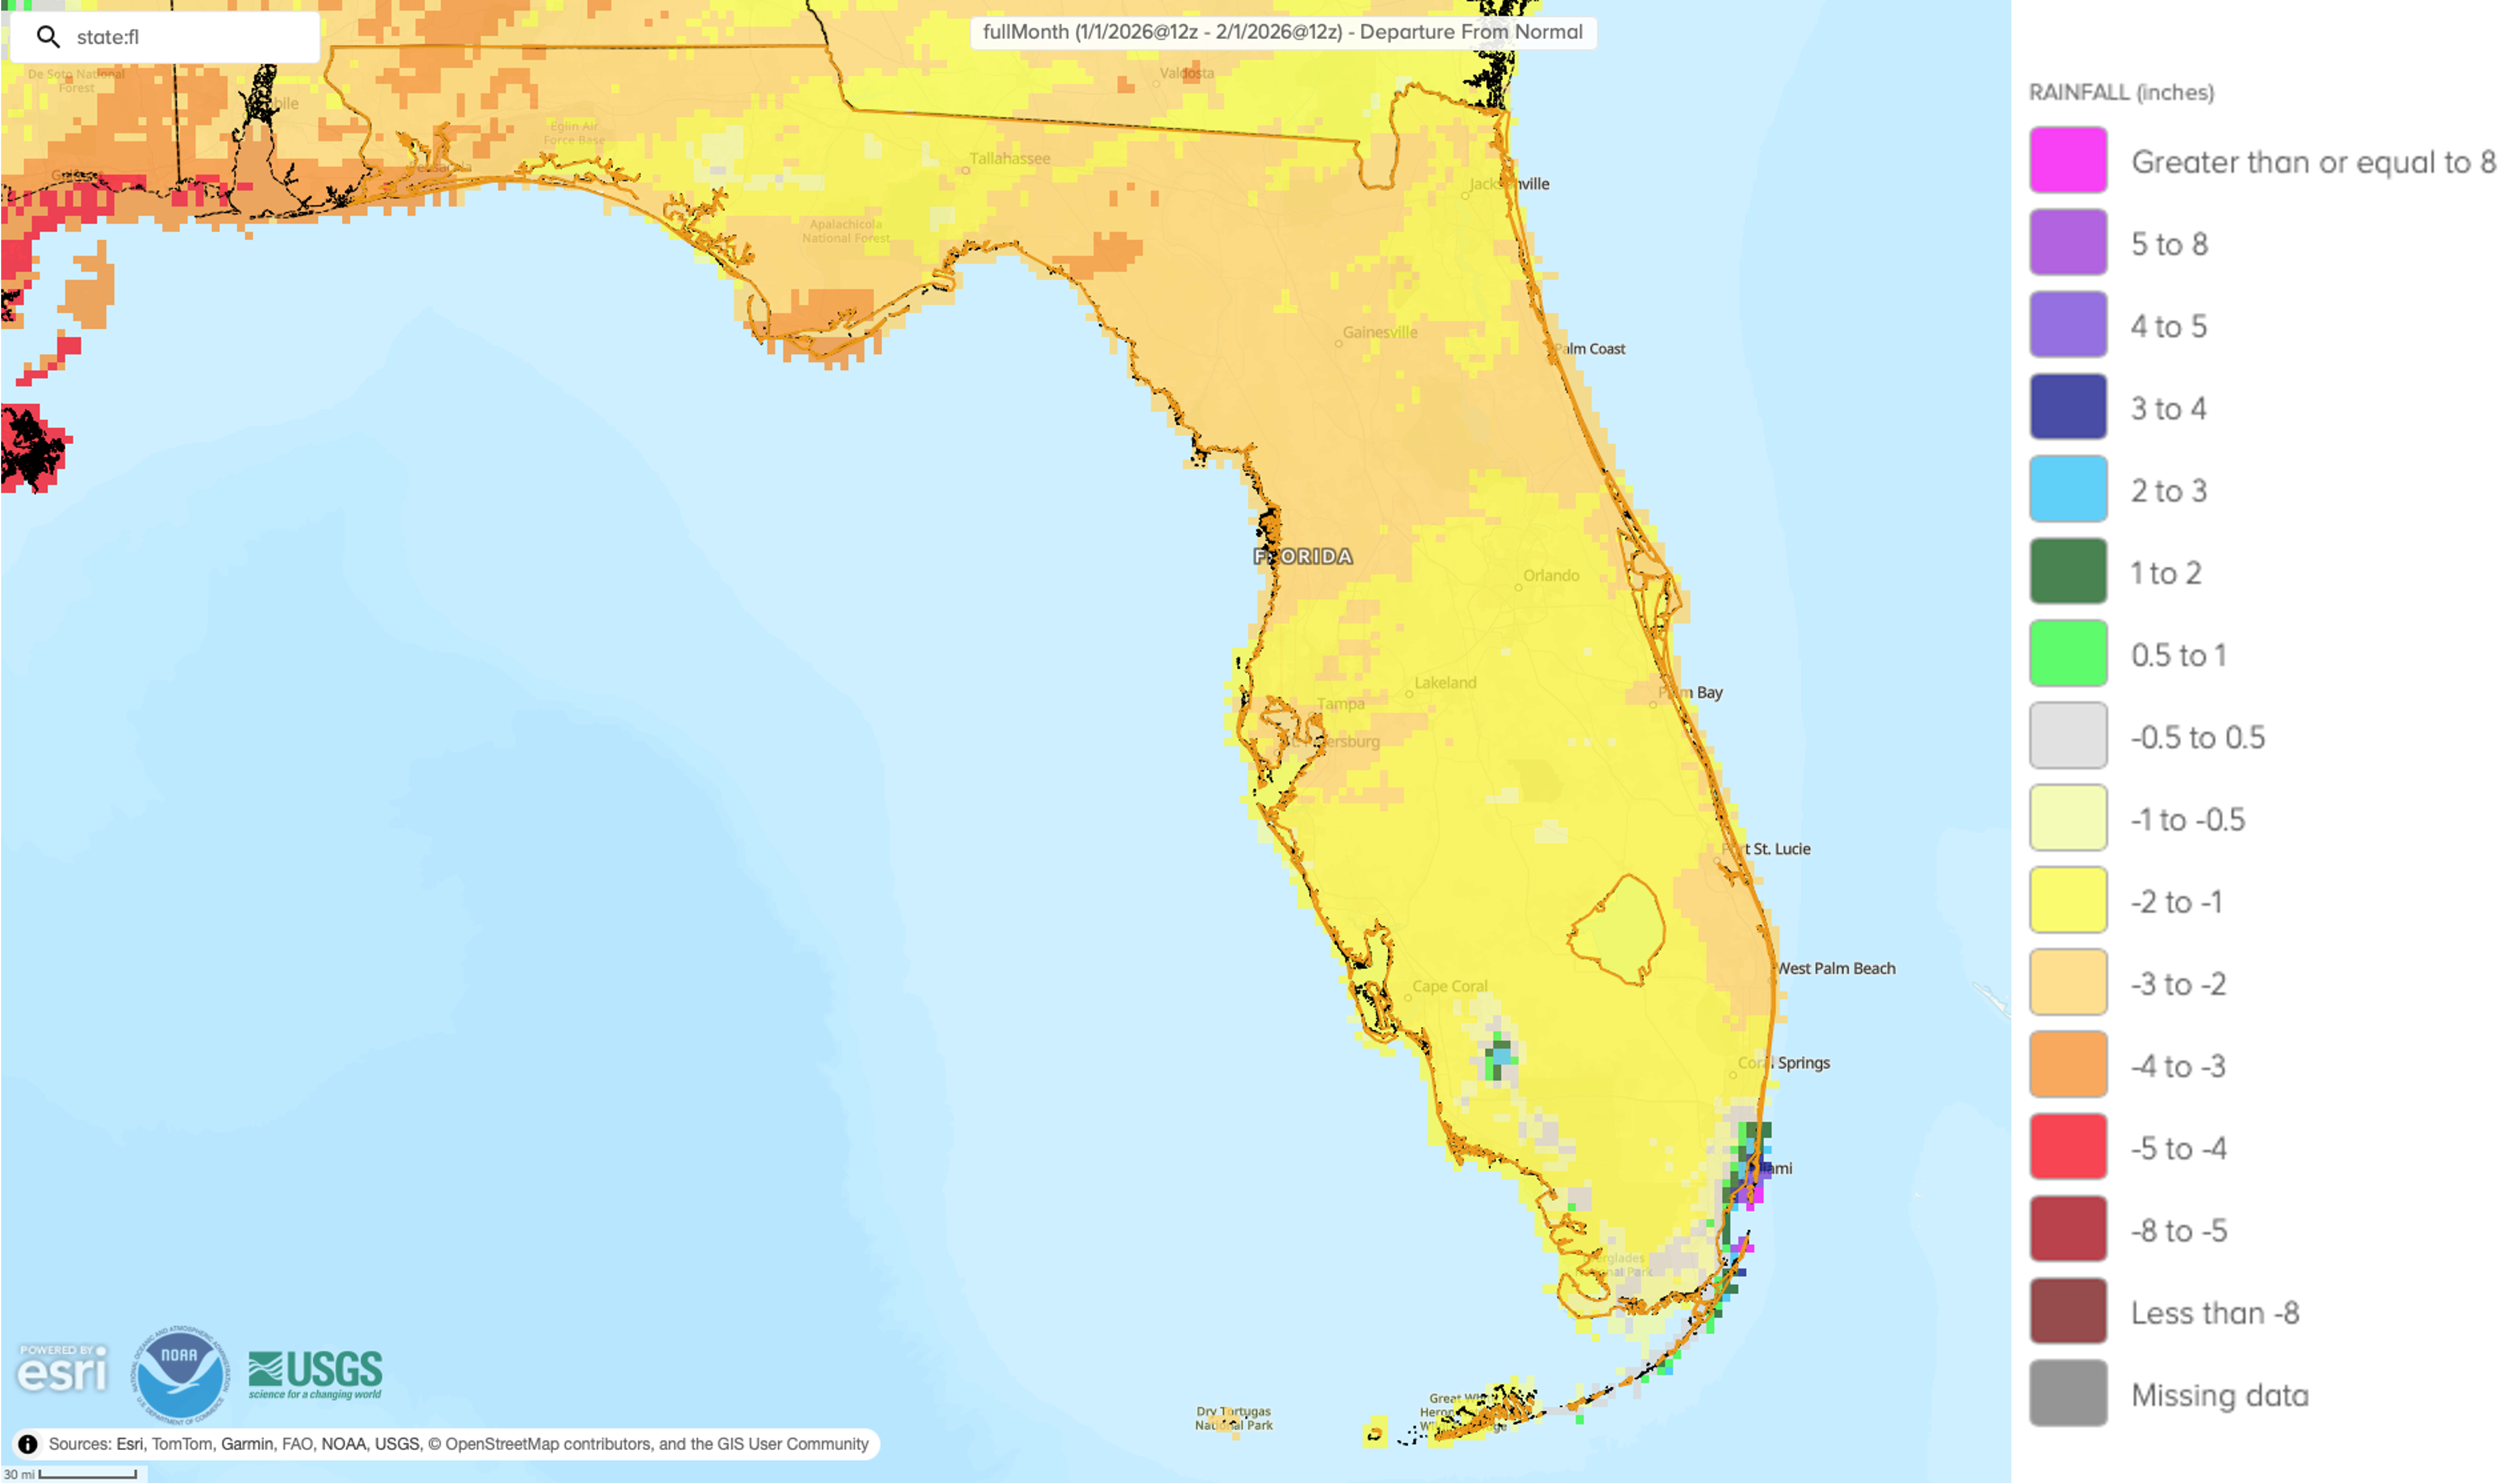
- Monthly precipitation totals in January were below normal across Florida, with two rounds of wintry precipitation during the month.
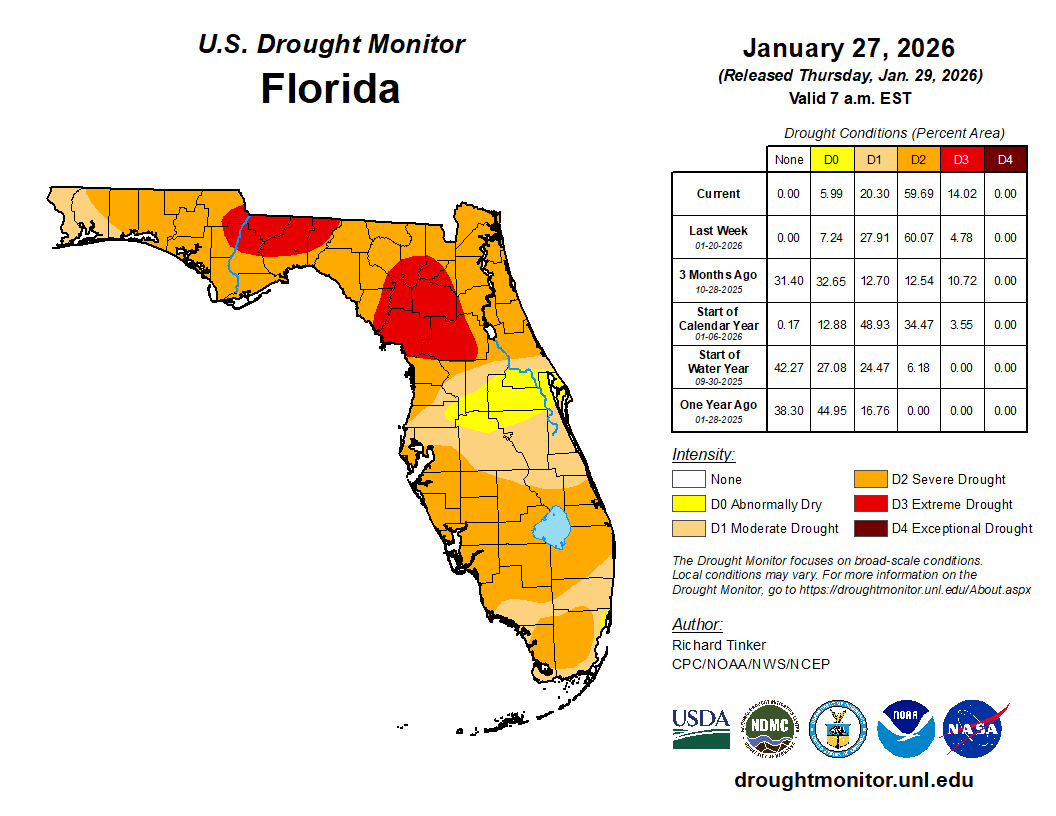
- Drought conditions persisted or deteriorated in Florida during January and 94% of the state was in some level of drought (D1-D4) by month’s end.
- A La Niña advisory continued in the equatorial Pacific Ocean and a transition to ENSO-neutral is expected during January-March 2026 (75% chance) that will likely persist through at least spring 2026.
Monthly temperatures in January averaged out to near normal in Florida. Average monthly temperature departures from normal ranged from -1.1 ̊F in Miami to +0.8 ̊F in West Palm Beach for the month (see Table 1 and Appendix 1 for select cities). January was a month of temperature whiplash in Florida. The early part of the month experienced mostly above average temperatures. Two new daily record highs were set on the 7th, including Tallahassee at 80 ̊F (previous record was 79 ̊F in 1916) and Apalachicola at 77 ̊F (tied with 1974). This warm spell was followed by a strong cold front mid-month during the MLK weekend, bringing cold air and snow to the Florida Panhandle on the morning of the 18th. Temperatures climbed to above freezing that day, so any snow accumulations melted quickly. As the front moved south through the state on the 18th, strong wind gusts of 40-60 mph were reported across central Florida accompanied by rapid temperature drops of -20 ̊F, or more, in one hour! The largest temperature drop was reported in Kissimmee with a drop of 31 ̊F in one hour. A major ice and snowstorm impacted the U.S. South, from Texas to Georgia and the Carolinas, on January 24-25, but Florida stayed south of the wintry weather. Parts of South Florida were record warm on the 25th and 26th before another strong cold front moved through the state on the 26-27th, which was reinforced by more Arctic air that kept temperatures well below normal across the state for the remainder of the month. In the overnight hours of January 31 to February 1, single-digit wind chill temperatures were felt in the interior portions of the western Panhandle, wind chills below 20 ̊F were felt as far south as Lake Okeechobee, and wind chills in South Florida were generally 25 ̊F – 30 ̊F. Freezing temperatures were observed across the Florida Peninsula, except along the southwest and southeast coasts. Tallahassee experienced 10 nights in January with minimum temperatures at or below 26 ̊F which ties as the 4th highest number of nights in January on record. Select daily record low minimum temperatures tied or broken during January are provided in Appendix 2.
Table 1. January average temperatures and departures from normal ( ̊F) for select cities.
| Station | Mean Temperature | Departure from Normal |
| Pensacola | 52.8 | -0.4 |
| Tallahassee | 51.2 | -1.0 |
| Jacksonville | 54.1 | -0.1 |
| Orlando | 60.4 | -0.2 |
| Tampa | 61.4 | -0.6 |
| Miami | 67.5 | -1.1 |
| Key West | 69.6 | -1.0 |
Figure 1. Monthly average temperature departures from normal (°F) in Florida for January 2026.
Monthly precipitation totals in January were below normal across Florida. The monthly precipitation departures from normal ranged from -3.04 inches in West Palm Beach to -0.19 inches in Miami (see Table 2 and Appendix 1 for select locations). Overall monthly precipitation was below normal across the state with widespread deficits of 1-3 inches. Northwest Florida saw snow on the morning of the 18th, almost one year to the day from last year’s record snowfall. A trace of snow was reported in Pensacola and Crestview, while CoCoRaHS observers reported snowfall totals of 0.1 inches in Niceville (OK-1), 1.0 inch in Baker (OK-52), and 0.7 and 0.5 inches in Santa Rosa County (SR-42 and SR-43, respectively). Snow accumulated on grass, trees and other surfaces, but roadways stayed clear as temperatures stayed above freezing. On January 31st, snow flurries were observed again in the Panhandle and across North Florida, with Tallahassee, Jacksonville and Lake City seeing a trace of snow. Flurries were also reported along the west coast of Florida from Levy to Lee Counties. The Tampa Bay area has recorded snow two times before dating back to 1892, including 0.2 inches on January 19, 1977 and 0.1 inches on February 13, 1899, and several other years have recorded a trace of snow.
Table 2. January precipitation totals and departures from normal (inches) for selected cities.
| Station | Total Rainfall | Departure from Normal |
| Pensacola | 2.60 | -2.43 |
| Tallahassee | 3.01 | -1.40 |
| Jacksonville | 1.30 | -1.98 |
| Orlando | 0.69 | -1.79 |
| Tampa | 0.99 | -1.66 |
| Miami | 1.64 | -0.19 |
| Key West | 0.59 | -1.24 |
Figure 2. A graphical depiction of the monthly rainfall departure from normal (inches) for January 2026 (courtesy of NOAA, NWS).
La Niña Advisory.
As of mid-January, the tropical equatorial Pacific Ocean remained in a La Niña state. Below-average sea surface temperatures continued across the east-central region of the equatorial Pacific Ocean. Subsurface temperature anomalies became slightly positive, and atmospheric anomalies across the tropical Pacific remained consistent with La Niña. A transition to ENSO-neutral is expected during January-March 2026 (75% chance). ENSO-neutral is likely to continue through at least the Northern Hemisphere late spring 2026. The probability for an El Niño increases (48%-51% chance) beyond the May-July 2026 timeframe.
Hazardous Weather Events in January.
According to the Local Storm Reports issued by the local National Weather Service offices serving Florida, there were 214 individual local reports of hazardous weather events recorded across the state during the month of January (see Table 3 for a breakdown by event type). There were many reports of snow, as well as strong wind gusts that caused damages due to downed trees and power lines.
Table 3. Breakdown of storm reports submitted in Florida during the month of January (compiled from Iowa State University/Iowa Environmental Mesonet).
| Report Type | Number of Reports |
| Heavy Rain | 0 |
| Dense Fog | 0 |
| Hail | 1 |
| Marine Thunderstorm Wind | 16 |
| Non-Thunderstorm Wind Gust | 108 |
| Tornado/Waterspout/Funnel Cloud | 1 / 3 / 0 |
| Thunderstorm Wind Damage | 27 |
| Non-Thunderstorm Wind Damage | 9 |
| Thunderstorm Wind Gust | 18 |
| Snow | 31 |
Daily Record Events in January.
Table 4. Summary of daily records broken or set in Florida in January 2026 (source: NCEI Daily Weather Records).
| Category | Number of Records |
| Highest daily max. temp. | 43 |
| Highest daily min. temp. | 13 |
| Lowest daily max. temp. | 10 |
| Lowest daily min. temp. | 23 |
| Highest daily precipitation | 4 |
| Total | 93 |
Drought-Related Impacts.
By mid-month, drought continued to affect nearly all of Florida with 92% of the state in some level of drought (D1-D4). Drought conditions have caused some harm to agricultural pasture conditions, elevated fire risk, and decreased streamflows and some reservoir levels. In mid-January, approximately 5% of the state was in extreme drought (D3), 50% was in severe drought (D2), and 37% was in moderate drought (D1); about 8% of the state was abnormally dry (D0), according to the U.S. Drought Monitor. By the end of the month, approximately 14% of the state was in extreme drought (D3), 60% was in severe drought (D2), 20% was in moderate drought (D1), and 6% of the state was abnormally dry (D0) (Figure 2 below).
As of January 31, the Lake Okeechobee water level was 12.77 ft. above sea level (Feet-NGVD29), which is below average for this time of year. At the first of January, the water level was 13.33 ft. above sea level.
Figure 3. A graphical depiction of the latest drought conditions in Florida according to the U.S. Drought Monitor (courtesy of the National Drought Mitigation Center, University of Nebraska-Lincoln).
Agriculture-Related Impacts.
Appendix 1
Additional January departures from normal data for select Florida locations (source: NWS).
| Station | Average Temperature (˚F) | Departure from Normal (˚F) | Total Rainfall (in.) | Departure from Normal (in.) |
| Gainesville | 55.0 | +0.2 | 1.23 | -2.06 |
| Sarasota | 62.2 | -0.2 | 1.54 | -1.25 |
| Melbourne | 61.0 | -0.7 | 0.31 | -2.32 |
| Fort Myers | 64.6 | -0.1 | 0.51 | -1.92 |
| West Palm Beach | 67.1 | +0.8 | 0.43 | -3.04 |
Appendix 2
Select daily record low minimum temperatures tied or broken during January (compiled from NOAA).
| Station | Date | Record (˚F) | Broken/Tied | Last |
| Homestead | 2 | 40 | Broken | 44 in 2001 |
| Apalachicola | 16 | 25 | Broken | 27 in 1978 |
| Hastings | 16 | 28 | Tied | 28 in 1985 |
| Homestead | 16 | 36 | Broken | 40 in 2023 |
| Usher Tower | 16 | 21 | Broken | 23 in 1978 |
| Ochopee | 16 | 34 | Broken | 39 in 2023 |
| Marianna | 16 | 22 | Broken | 25 in 1959 |
| Gainesville | 16 | 24 | Broken | 28 in 1985 |
| Orlando | 16 | 31 | Broken | 35 in 1968 |
| Crestview | 16 | 22 | Broken | 23 in 1983 |
| Jacksonville | 16 | 22 | Broken | 25 in 1983 |
| Tallahassee | 16 | 19 | Broken | 20 in 1978 |
| Glen St. Mary | 20 | 9 | Broken | 19 in 1977 |
| Whiting Field NAS | 26 | 27 | Tied | 27 in 2001 |
| Mayo | 27 | 19 | Tied | 19 in 1985 |
| Niceville | 27 | 21 | Broken | 22 in 1985 |
| Marianna | 27 | 22 | Broken | 27 in 2000 |
| Pensacola | 27 | 22 | Broken | 24 in 1986 |
| Crestview | 27 | 21 | Broken | 23 in 2011 |
| Apalachicola | 29 | 26 | Broken | 28 in 2007 |
| Ochopee | 29 | 39 | Tied | 39 in 2022 |
| Tallahassee | 29 | 22 | Broken | 23 in 2004 |
| Quincy | 30 | 24 | Tied | 24 in 1973 |