
Prepared by Florida Climate Center
The Florida State University
Tallahassee, FL

Summary:
- Monthly average temperatures in October were near normal overall in Florida.
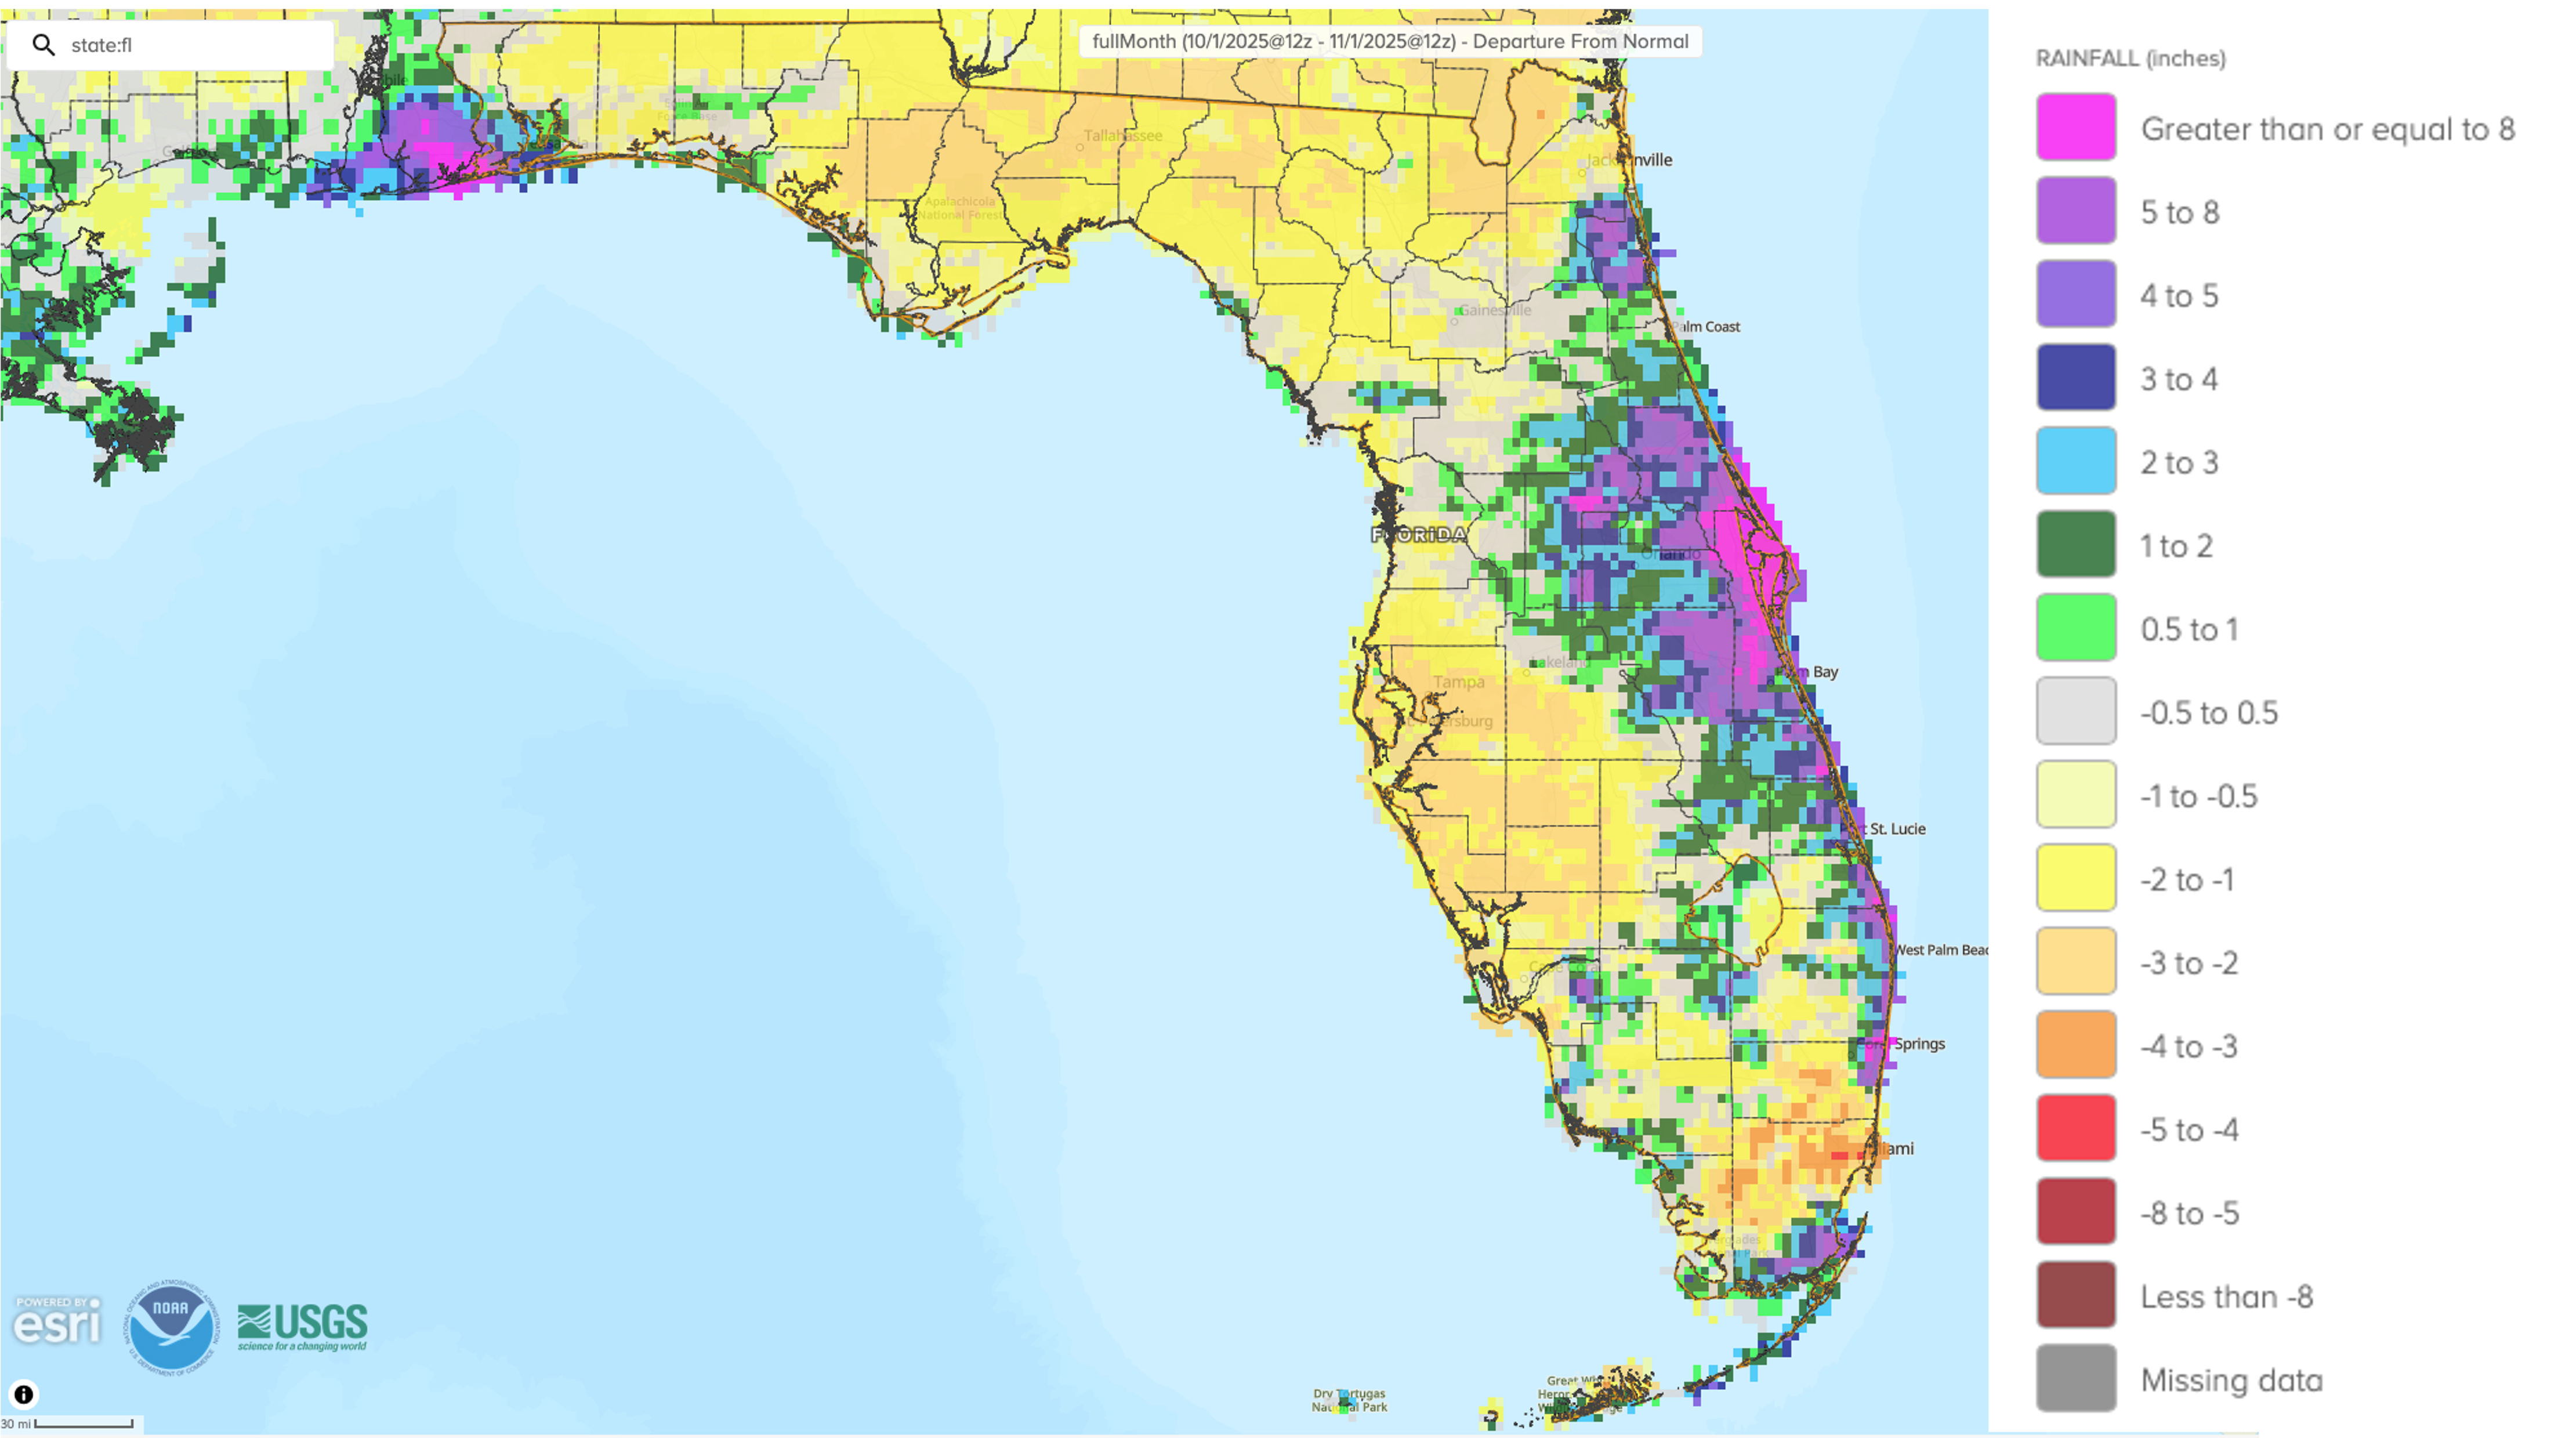
- Monthly precipitation totals in October were below normal in northern Florida, the west coast, and southeastern Florida; and they were above to well above normal in central Florida and the east coast.
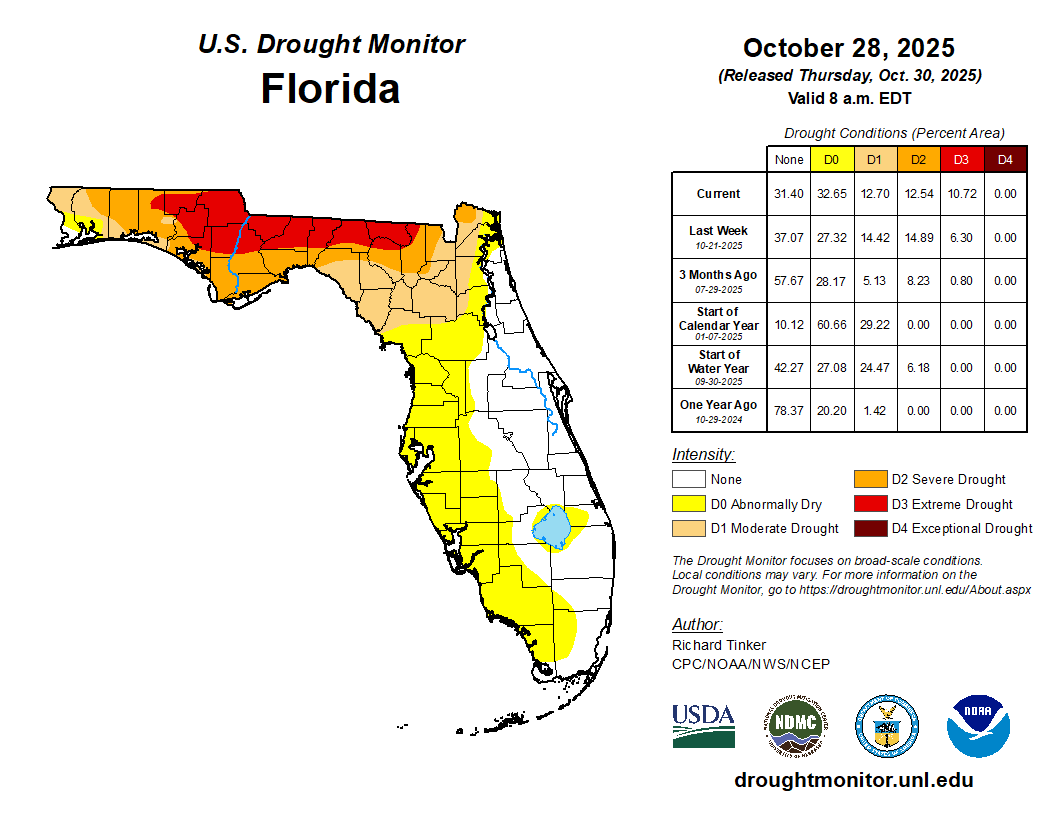
- Drought deteriorated in northern Florida during October with the introduction of extreme drought (D3), while abnormally dry conditions (D0) expanded along the west coast.
- La Niña has developed in the equatorial Pacific Ocean and is favored to persist through February 2026, with a transition to ENSO-neutral conditions expected during January-March 2026 (55% chance).
Table 1. October average temperatures and departures from normal ( ̊F) for select cities.
| Station | Mean Temperature | Departure from Normal |
| Pensacola | 71.5 | +0.2 |
| Tallahassee | 69.9 | -0.4 |
| Jacksonville | 70.4 | -0.8 |
| Orlando | 75.5 | 0.0 |
| Tampa | 78.5 | +1.1 |
| Miami | 81.0 | +0.9 |
| Key West | 81.4 | +0.1 |
In the Florida Peninsula and along the east coast, a series of stalled fronts with onshore flows led to several rounds of locally heavy rainfall during the month. On the 26th, a stalled front across central Florida led to extreme rainfall across portions of northern Lake and northern Brevard counties. Two areas that received the heaviest rainfall were the Eustis and Mt. Dora areas with 14-19+ inches in less than 24 hours, and along the coast around Titusville and the Cape Canaveral area with around 6-13 inches. Titusville recorded an all-time daily record rainfall of 13.10 inches, with data going back 109 years. In addition, Titusville had its wettest October on record with a total of 21.08 inches, which was 16.02 inches above normal for the month. Several stations along the central-east coast are experiencing one of their wettest falls on record, September-October, including Titusville (1st-wettest), Daytona Beach (5th-wettest, based on 102 years), and Melbourne (9th-wettest, based on 83 years). Daily rainfall records broken during the month for select locations are provided in Appendix 2.
Table 2. October precipitation totals and departures from normal (inches) for selected cities.
| Station | Total Rainfall | Departure from Normal |
| Pensacola | 6.98 | +2.28 |
| Tallahassee | 0.95 | -2.29 |
| Jacksonville | 2.44 | -1.59 |
| Orlando | 4.53 | +1.07 |
| Tampa | 0.39 | -1.95 |
| Miami | 3.48 | -4.17 |
| Key West | 5.13 | -0.54 |
Figure 1. A graphical depiction of the monthly rainfall departure from normal (inches) for October (courtesy of NOAA, NWS).
La Niña Advisory.
La Niña conditions emerged in September 2025 with an expansion of below-average sea surface temperatures (SSTs) in the tropical equatorial Pacific Ocean. The latest weekly Niño-3.4 index value was -0.5°C, and other regions were at or between -0.1°C and -0.4°C. Negative subsurface temperature anomalies prevailed from the surface to a depth of 200m in the eastern equatorial Pacific Ocean. La Niña conditions are expected to persist through February 2026, with a transition to ENSO-neutral likely in January-March 2026 (55% chance).
Hazardous Weather Events in October.
According to the Local Storm Reports issued by the local National Weather Service offices serving Florida, there were 273 individual local reports of hazardous weather events recorded across the state during the month of October (see Table 3 for a breakdown by event type). Multiple reports of minor to moderate tidal flooding from King tides occurred along east and west coastal areas, with reports of street flooding impacting transportation. Heavy rainfall and flash flooding were reported in Brevard south to Broward counties on the 26-27th, as well as in Lake County where over 19 inches were reported in the Eustis and Mount Dora areas in under 24 hours. Other areas also saw extreme rainfall rates, such as Boca Raton which reported 5-7+ inches in 2 hours during this event. These excessive rainfall totals overwhelmed stormwater systems and caused substantial impacts in these areas, including numerous flooded homes and widespread street flooding that stranded vehicles and washed out portions of roadways, according to the National Weather Service. Also on the morning of the 27th, two tornadoes were reported in Bay County near Mexico Beach – an EF1 tornadic waterspout that moved onshore with estimated peak winds of 100 mph that had a path length of 1.23 miles, and a brief EF0 tornado with estimated peak winds of 70 mph and a path length of about 0.5 miles. The tornadoes caused damages to structures and the EF1 tornado led to 10 injuries. No fatalities were reported.
Table 3. Breakdown of storm reports submitted in Florida during the month of October (compiled from Iowa State University/Iowa Environmental Mesonet).
| Report Type | Number of Reports |
| Heavy Rain | 53 |
| Flash Flood | 14 |
| Flood | 16 |
| Hail | 1 |
| Marine Thunderstorm Wind | 9 |
| Non-Thunderstorm Wind Gust | 27 |
| Tornado/Waterspout/Funnel Cloud | 2 / 3 / 3 |
| Thunderstorm Wind Damage | 5 |
| Non-Thunderstorm Wind Damage | 1 |
| Thunderstorm Wind Gust | 39 |
| Rip Currents | 1 |
Daily Record Events in October.
Table 4. Summary of daily records broken or set in Florida in October (source: NCEI Daily Weather Records).
| Category | Number of Records |
| Highest daily max. temp. | 1 |
| Highest daily min. temp. | 5 |
| Lowest daily max. temp. | 13 |
| Lowest daily min. temp. | 0 |
| Highest daily precipitation | 26 |
| Total | 45 |
Drought-Related Impacts.
Drought persisted and deteriorated across northern Florida during October. In mid-October, approximately 5% of the state was in extreme drought (D3), 16% was in severe drought (D2), another 13% was in moderate drought (D1), and 25% was abnormally dry (D0), according to the U.S. Drought Monitor. By the end of the month, approximately 11% of the state was in extreme drought (D3), 13% was in severe drought (D2), 13% was in moderate drought (D1), and 33% of the state was abnormally dry (D0) (Figure 2 below).
As of October 31, the Lake Okeechobee water level was 13.91 ft. above sea level (Feet-NGVD29), which is below average for this time of year. At the first of the month, the water level was 13.53 ft. above sea level.
Figure 2. A graphical depiction of the latest drought conditions in Florida according to the U.S. Drought Monitor (courtesy of the National Drought Mitigation Center, University of Nebraska-Lincoln).
Appendix 1
Additional October departures from normal data for select Florida locations (Source: NWS).
| Station | Average Temperature (˚F) | Departure from Normal (˚F) | Total Rainfall (in.) | Departure from Normal (in.) |
| Gainesville | 72.0 | +0.6 | 2.50 | -0.18 |
| Sarasota | 78.2 | +0.9 | 0.90 | -1.86 |
| Melbourne | 76.1 | -0.2 | 11.50 | +6.64 |
| Fort Myers | 78.9 | +0.9 | 2.48 | -0.60 |
| West Palm Beach | 79.9 | +1.2 | 8.84 | +2.94 |
Appendix 2
Select daily record precipitation totals (inches) broken during October 2025 (compiled from NOAA).
| Location | Date | Record (˚F) | Broken/Tied | Last |
| Daytona Beach | 2 | 2.40 | Broken | 1.94 in 1948 |
| Melbourne | 5 | 1.90 | Broken | 1.40 in 1990 |
| Naples | 11 | 3.70 | Broken | 1.71 in 1947 |
| Pensacola | 26 | 2.34 | Broken | 1.57 in 2002 |
| Vero Beach | 26 | 3.77 | Broken | 1.28 in 2019 |
| West Palm Beach | 26 | 2.37 | Broken | 1.62 in 2012 |
| Orlando | 26 | 2.94 | Broken | 0.54 in 2012 |
| Deland | 27 | 2.50 | Broken | 2.30 in 1925 |
| Lisbon | 27 | 2.45 | Broken | 0.95 in 1997 |
| Sanford | 27 | 2.50 | Broken | 0.66 in 1989 |
| Stuart | 27 | 2.72 | Broken | 2.25 in 1989 |
| Titusville | 27 | 13.10 | Broken | 1.15 in 1969 |
| Vero Beach | 27 | 3.63 | Broken | 1.15 in 2019 |
| Deland | 28 | 2.50 | Broken | 1.15 in 1916 |