
Prepared by Florida Climate Center
The Florida State University
Tallahassee, FL

Summary:
- Monthly average temperatures in June were near to above normal across Florida.
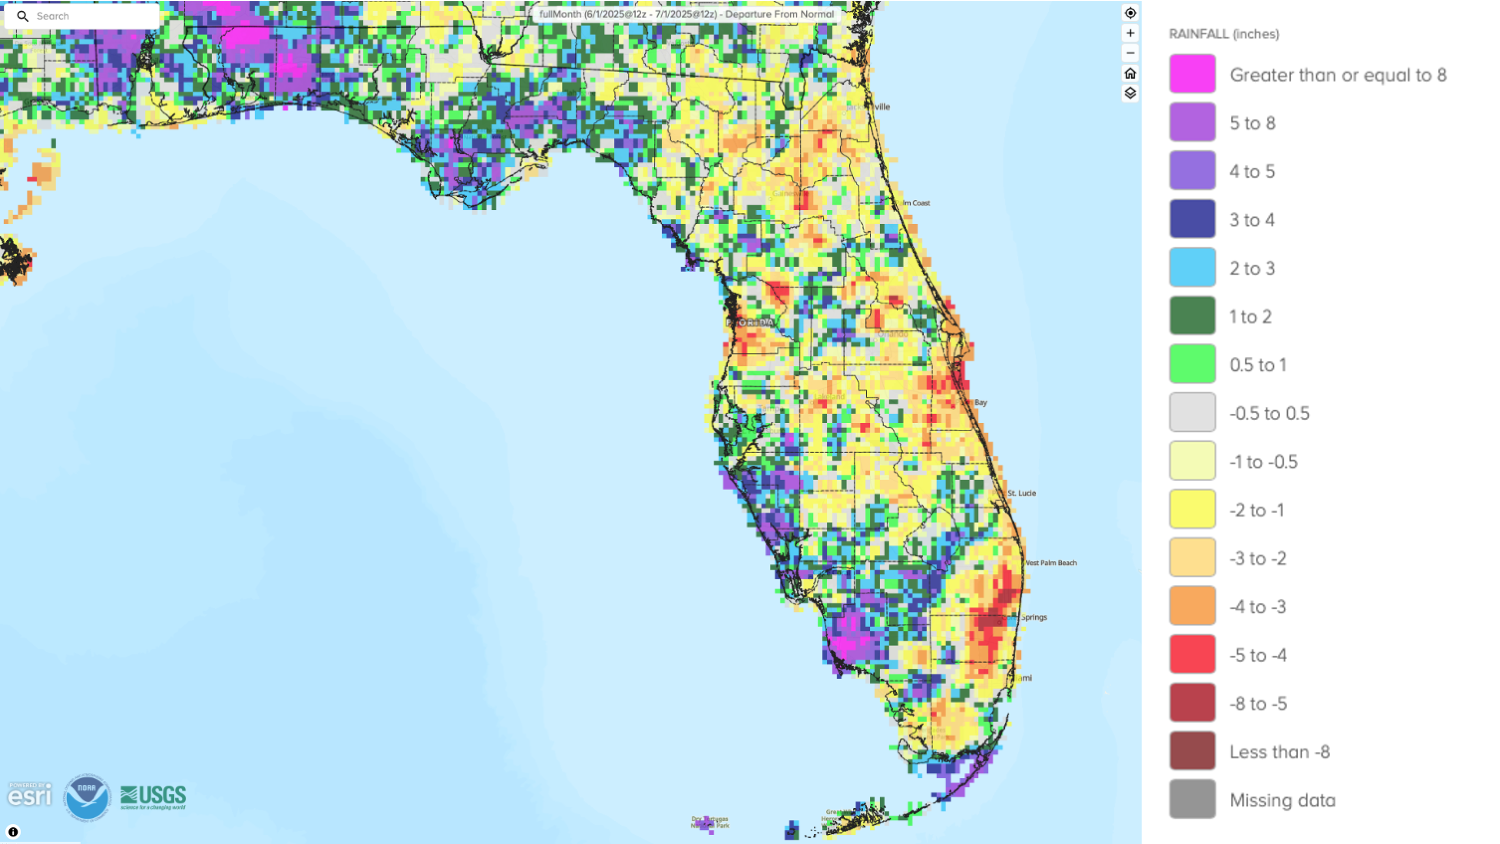
- Monthly precipitation totals in June were generally below normal across eastern Florida and above normal in southwest Florida and much of the Panhandle.
- While drought conditions improved during the month, extreme drought (D3) was reintroduced in Palm Beach County by the end of June.
- ENSO-neutral conditions continued in the tropical Pacific Ocean and are expected to persist through the Northern Hemisphere summer (82% chance during June-August).
Table 1. June average temperatures and departures from normal ( ̊F) for selected cities.
| Station | Mean Temperature | Departure from Normal |
| Pensacola | 81.4 | -0.3 |
| Tallahassee | 81.9 | +1.1 |
| Jacksonville | 82.1 | +1.8 |
| Orlando | 82.8 | +1.6 |
| Tampa | 83.4 | +0.5 |
| Miami | 83.2 | +0.4 |
| Key West | 84.2 | +0.1 |
Table 2. June precipitation totals and departures from normal (inches) for selected cities.
| Station | Total Rainfall | Departure from Normal |
| Pensacola | 5.10 | -2.22 |
| Tallahassee | 10.37 | +2.61 |
| Jacksonville | 3.92 | -3.68 |
| Orlando | 4.71 | -3.34 |
| Tampa | 6.21 | -1.16 |
| Miami | 8.41 | -2.10 |
| Key West | 4.57 | +0.34 |
Figure 1. A graphical depiction of the monthly rainfall departure from normal (inches) for June (courtesy of NOAA, NWS).
ENSO-Neutral Conditions Present in Pacific.
ENSO-neutral conditions are currently present in the tropical equatorial Pacific Ocean. Over the past month, near-average sea surface temperatures covered most of the equatorial Pacific Ocean, and the latest weekly Niño index values ranged from -0.1 ̊C to +0.4 ̊C. ENSO-neutral conditions are favored to persist through the Northern Hemisphere summer (82% chance during June-August) and may persist into winter 2025-26, though uncertainty is higher with a 48% chance of ENSO-neutral and 41% chance of La Niña in November-January.
Hazardous Weather Events in June.
According to the Local Storm Reports issued by the local National Weather Service offices serving Florida, there were 335 individual local reports of hazardous weather events recorded across the state during the month of June (see Table 3 for a breakdown by event type). It has been an active weather season in Florida and across the Southeast. There were several reports of quarter to ping pong sized hail during the month, and multiple incidents due to strong winds. On the 4th, strong wind gusts of between 45 and 55 mph were responsible for a crane collapse in Brevard County that resulted in two fatalities. Strong wind gusts also led to the capsizing of boats offshore, leading to multiple injuries. On the 28th, multiple vessels capsized and grounded off the coast in Saint Joseph Sound due to hazardous winds and seas, leading to 15 water rescues and one injury. Lightning strikes led to one hospitalization and one fatality during the month. Another fatality due to drowning from rip currents was reported in Cape San Blas.
Table 3. Breakdown of storm reports submitted in Florida during the month of June (compiled from Iowa State University/Iowa Environmental Mesonet).
| Report Type | Number of Reports |
| Heavy Rain | 6 |
| Flash Flood | 9 |
| Flood | 3 |
| Hail | 34 |
| Marine Thunderstorm Wind | 67 |
| Non-Thunderstorm Wind Gust | 0 |
| Tornado/Waterspout/Funnel Cloud | 3 / 8 / 1 |
| Thunderstorm Wind Damage | 69 |
| Non-Thunderstorm Wind Damage | 0 |
| Thunderstorm Wind Gust | 128 |
| Lightning | 5 |
| Rip Currents | 2 |
Daily Record Events in June.
Table 4. Summary of daily records broken or set in Florida in June (source: NCEI Daily Weather Records).
| Category | Number of Records |
| Highest daily max. temp. | 8 |
| Highest daily min. temp. | 25 |
| Lowest daily max. temp. | 9 |
| Lowest daily min. temp. | 1 |
| Highest daily precipitation | 12 |
| Total | 55 |
Drought-Related Impacts.
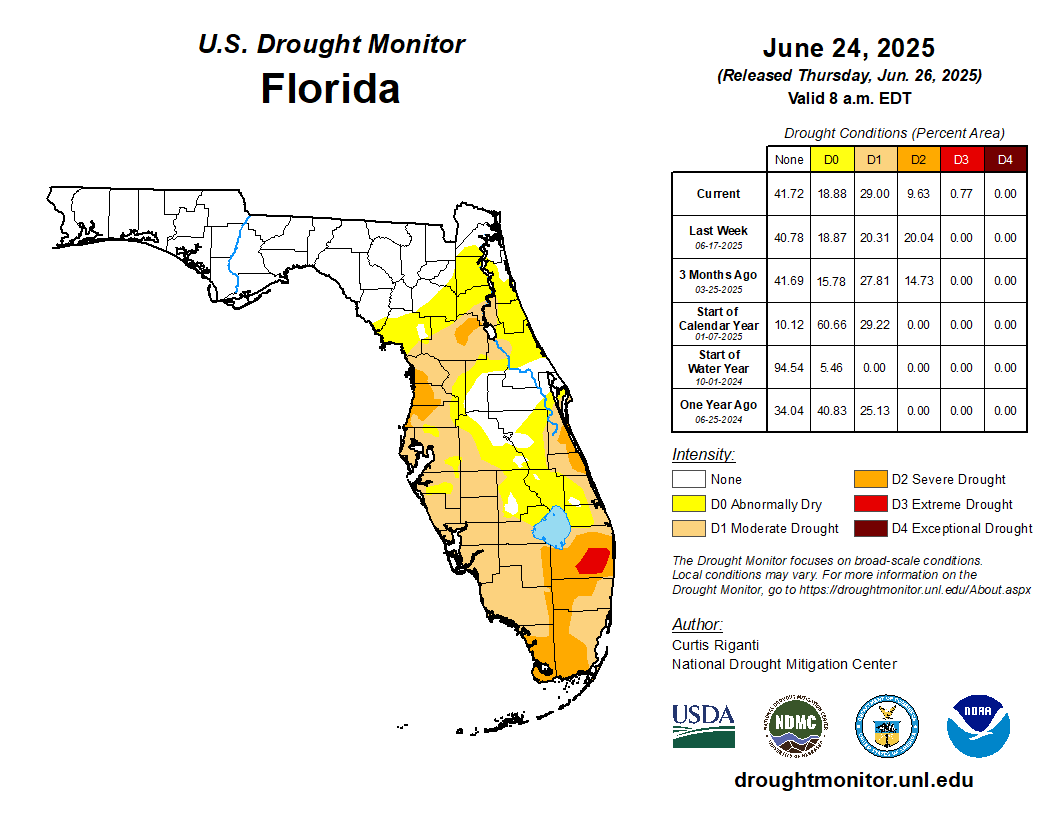
Drought has improved over the past month, with long-term rainfall deficits and drought impacts lingering in the Peninsula. In mid-June, approximately 20% of the state was in severe drought (D2), 20% of the state was in moderate drought (D1), and 19% was abnormally dry (D0), according to the U.S. Drought Monitor. By the end of the month, extreme drought (D3) was reintroduced in Palm Beach County, where rainfall deficits have been increasing. By the end of the month, approximately 1% of the state was in extreme drought (D3), 10% was in severe drought (D2), 29% was in moderate drought (D1), and 19% of the state was abnormally dry (D0) (Figure 2 below).
As of June 30, the Lake Okeechobee water level was 11.17 ft. above sea level (Feet-NGVD29), which is below average for this time of year and right at the water shortage management level. At the first of the month, the water level was 10.97 ft. above sea level. Lake Okeechobee levels have been slow to respond to summer rainfall, and on June 27 the Martin County Department of Health issued a water advisory due to toxic algae in the lake.
Figure 3. A graphical depiction of the latest drought conditions in Florida according to the U.S. Drought Monitor (courtesy of the National Drought Mitigation Center, University of Nebraska-Lincoln).
Agriculture-Related Impacts.
In mid-June, topsoil moisture conditions were adequate in 67% of the state, short in 18%, and very short in 6% of the state, while 9% of the state had surplus topsoil moisture conditions. By the end of June, topsoil moisture conditions remained adequate in 67% of the state, were short in 17% of the state, and very short in 2% of the state, while 14% of the state had surplus topsoil moisture conditions. For more information, consult the Crop Progress and Conditions report, which is published by the USDA’s National Agricultural Statistics Service.
Appendix 1
Additional June departures from normal data for select Florida locations (Source: NWS).
| Station | Average Temperature (˚F) | Departure from Normal (˚F) | Total Rainfall (in.) | Departure from Normal (in.) |
| Gainesville | 82.3 | +2.4 | 6.22 | -1.34 |
| Sarasota | 81.3 | -0.5 | 13.53 | +6.48 |
| Melbourne | 81.5 | +0.9 | 3.53 | -3.57 |
| Fort Myers | 83.4 | +1.1 | 7.15 | -2.51 |
| Naples | 81.7 | -0.4 | 15.39 | +7.98 |
| West Palm Beach | 83.4 | +1.7 | 4.90 | -3.58 |
Appendix 2
Select daily record high minimum temperatures (°F) tied or broken during June 2025 (compiled from NOAA).
| Location | Date | Record (˚F) | Broken/Tied | Last |
| Key West | 5 | 85 | Broken | 83 in 2024 |
| Fort Lauderdale | 6 | 81 | Tied | 81 in 2016 |
| Marianna | 7 | 77 | Broken | 75 in 2024 |
| Jacksonville | 7 | 77 | Broken | 76 in 1985 |
| Tallahassee | 7 | 76 | Broken | 75 in 1995 |
| Pensacola | 8 | 81 | Broken | 80 in 1953 |
| Jacksonville | 8 | 78 | Broken | 76 in 1981 |
| Apalachicola | 9 | 81 | Broken | 79 in 1981 |
| Miami | 10 | 80 | Tied | 80 in 2021 |
| Fort Pierce | 12 | 78 | Broken | 77 in 1969 |
| West Palm Beach | 13 | 82 | Broken | 81 in 2015 |
| Sanford | 15 | 79 | Broken | 77 in 2024 |
| Hastings | 18 | 74 | Broken | 73 in 2016 |
| Key West | 18 | 85 | Broken | 84 in 1964 |
| Fort Lauderdale Beach | 19 | 82 | Broken | 81 in 2021 |