Prepared by Lydia Stefanova, Daniel J. Brouillette, and David F. Zierden.
Florida Climate Center
The Florida State University
Tallahassee, FL

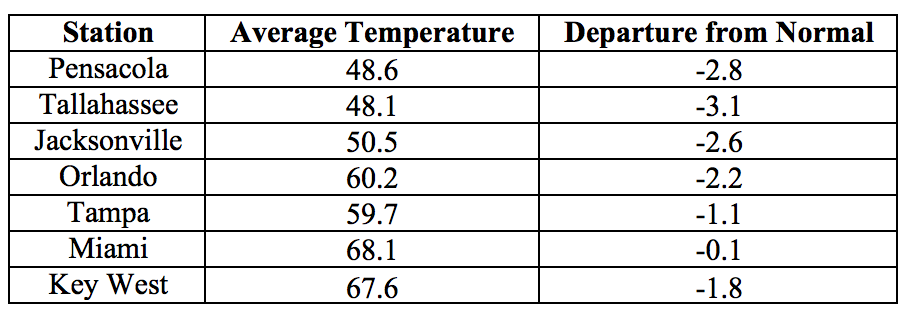
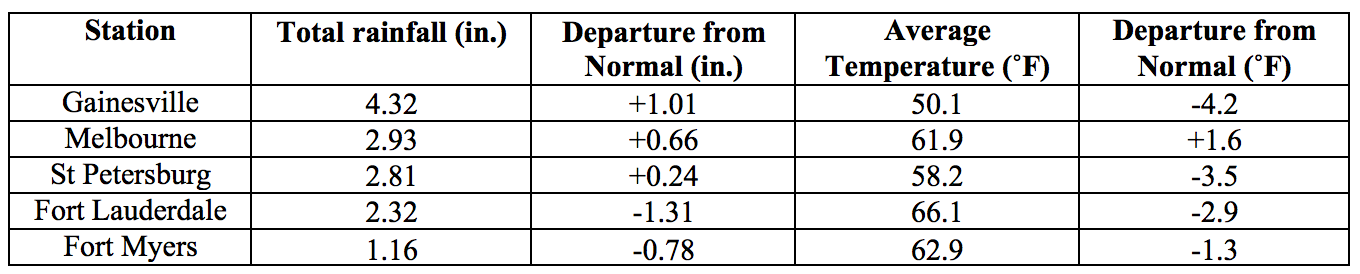
Average temperatures in January were below normal across the state. The departures from average temperatures in January 2018 were below normal across the entire state, with the exception of a single long-term measuring station (Melbourne). Measured departures from normal ranged from -4.2˚F in Gainesville to +1.6˚F in Melbourne (Table 1 and Appendix 1). Minimum temperatures at or below freezing were recorded in multiple days in the Panhandle and all the way to south-central Florida, ranging from 16 days in Tallahassee, 15 days in Gainesville, 12 days in Jacksonville, 11 days in Pensacola, 3 days in Orlando, and 1 day in Melbourne and Tampa. Despite this, for none of the long-term measuring stations with 100 or more years on record did the monthly mean temperatures rank amongst the bottom (or top) ten for January. A handful of daily temperature records were tied or broken across the state (Appendix 2).
Table 1: January average temperatures and departures from normal (˚F) for selected cities.
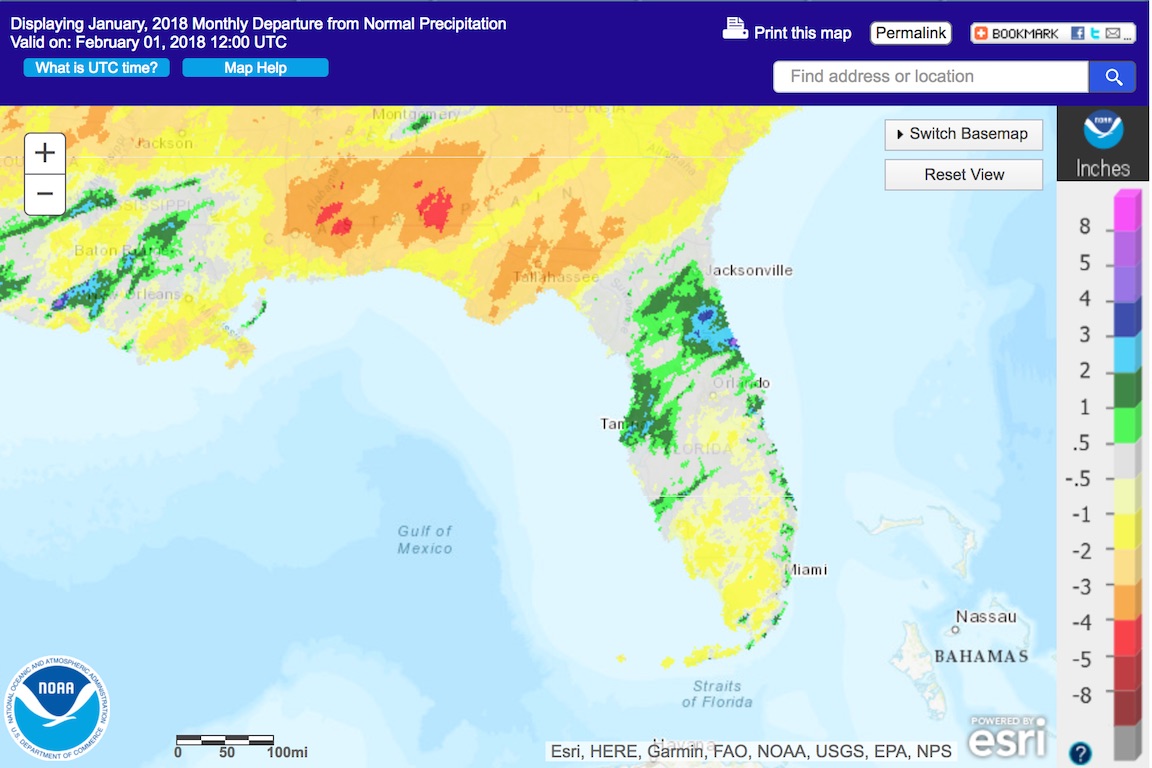
Rainfall totals in January were mixed across the state. Rainfall totals in January 2018 were below normal in the Panhandle and in most of South Florida, and above normal for most of the northern and central portions of the Peninsula (Figure 1). Departures from normal roughly ranged from -2.61” in Tallahassee to +2.77” in Tampa (Table 2 and Appendix 1), although localized parts of the state saw rainfall totals that were as much as 5.00” below normal to 5.00” above normal (Figure 1). One 24-hour rainfall record was broken for the month (Table 3). A record snowfall of 0.1’’ was measured in Tallahassee on January 3rd, breaking the old record of trace set in 2002. This was the first measurable snowfall for Tallahassee since December 23, 1989, and the first measurable snow on record (dating back to 1885) for Tallahassee during the month of January.
Table 2: January precipitation totals and departures from normal (inches) for select cities.
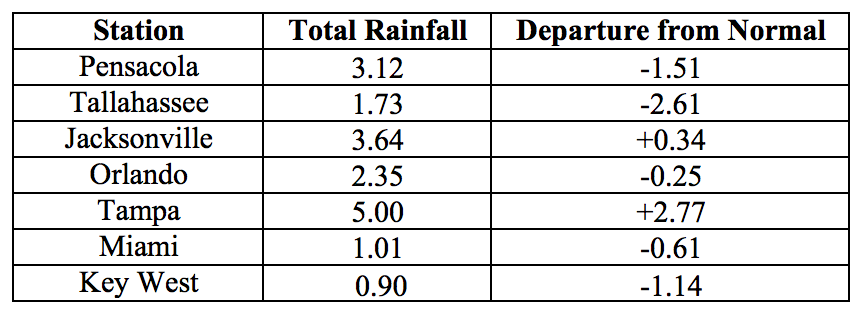
Table 3: Select daily rainfall records (inches) broken during January. (Compiled from NOAA, NWS).
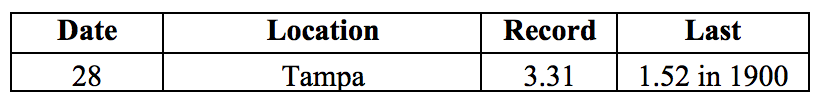
Figure 1: A graphical depiction of the monthly rainfall departure from normal (inches) for January is given in the figure below (courtesy of NOAA, NWS)
La Niña Conditions are Present in the Pacific.
Based on current data and forecast models, the Climate Prediction Center (CPC) ENSO Alert System Status is set to a La Niña advisory. ENSO-neutral conditions are currently present, with sea surface temperatures (SST) below average across the central and eastern equatorial Pacific Ocean. La Niña conditions are likely to persist through the end of winter, with a transition to ENSO-neutral expected during the spring. The CPC seasonal outlook favors above-normal temperatures and below-normal precipitation for Florida through April 2018.
Hazardous Weather Events in January.
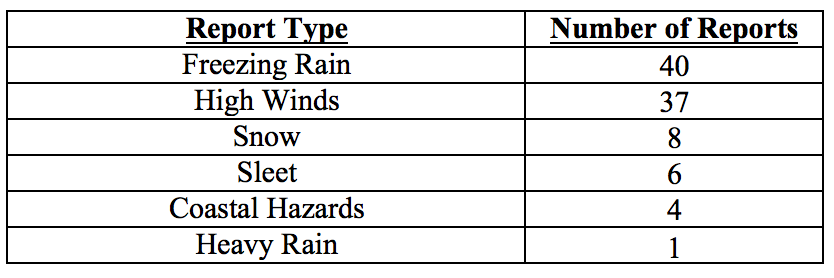
A total of 96 hazardous weather events were recorded in the National Weather Service Local Storm Reports database for January 2018. Over half (54 reports) were related to wintry precipitation (freezing rain, snow, or sleet), followed by high winds (37 reports). Most (41) of the wintry precipitation events were on the 3rd, and the remainder – on the 17th.
Most of the high wind events took place between the 1st and 3rd along the Atlantic Coast from Nassau to Volusia Counties, as a cold airmass pushed into the state, with reports of wind gusts of 40-50 mph. A strong winter storm prompted winter weather warnings for a large portion of the state on January 3rd, and schools were closed in a number of districts in anticipation of snow, sleet, and ice. On that day, freezing rain was seen in Nassau, Madison, Leon, Gadsden, Duval, Wakulla, Columbia, Taylor, Lafayette, Union, Alachua, Gilchrist, Dixie, and Levy Counties. Light snow was recorded in Leon and Union Counties, with an accumulation of 0.1’’ measured in Tallahassee. Icy conditions required closures of several highways and bridges in the Big Bend, including parts of Interstate 10. Ice accumulation of 0.25’’ was reported in Hilliard (Nassau County) and Lake City (Columbia County). Icing of power lines following the freezing rain resulted in several power outages in Columbia, Lafayette, and Nassau Counties.
A second winter storm affected the state on January 17th, bringing snow, sleet and freezing rain to much of the Panhandle. Light snow was observed in Bay and Walton Counties, and sleet or freezing rain was seen in Escambia, Okaloosa, Walton, Jackson, and Gadsden Counties.
Table 4: Breakdown of storm reports submitted in Florida during the month of January (Compiled from Iowa State University/Iowa Environmental Mesonet.)
Drought-Related Impacts.
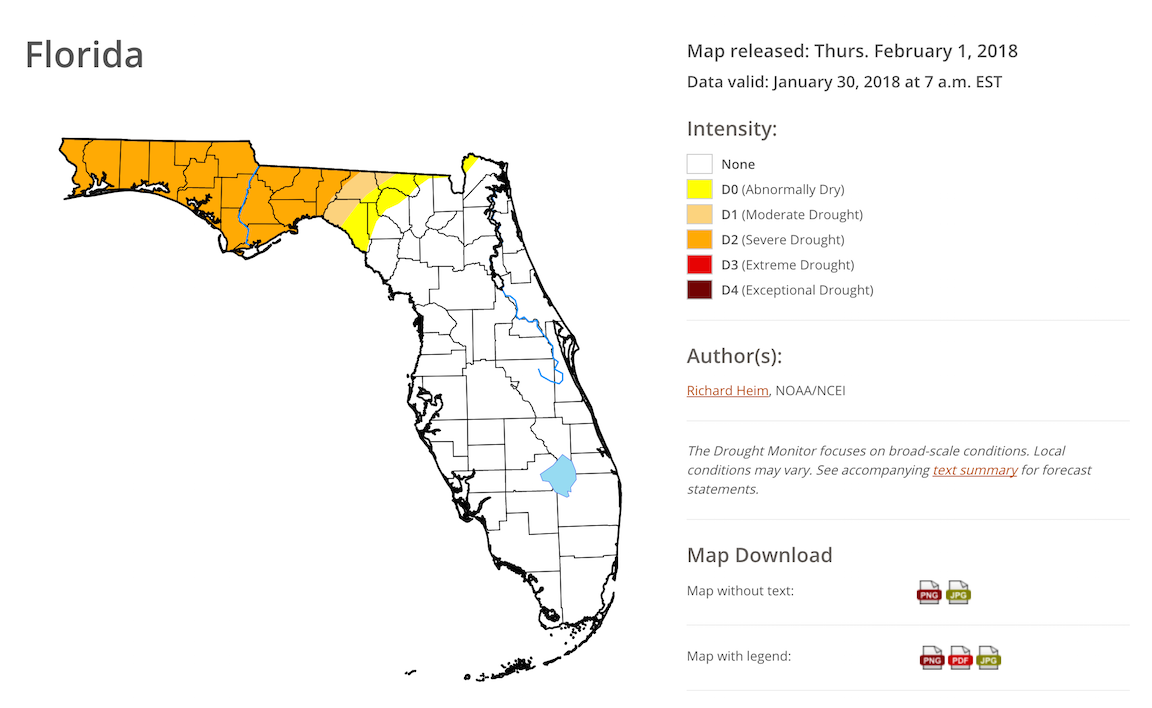
At the beginning of January, approximately 73% of the state was drought-free. The remainder of the state, encompassing the entire Panhandle, was either experiencing moderate drought (22%) or was abnormally dry (5%). The Panhandle drought gradually deepened as the month progressed, but the affected area expanded only slightly. As of the latest U.S. Drought Monitor Report, issued on the 30th, about 21% of the state – from Escambia to Jefferson County – is experiencing severe drought. Moderate drought conditions are affecting parts Taylor, Madison, and Hamilton Counties, and abnormally dry conditions are seen in parts of Taylor, Lafayette, Madison, Suwannee, Hamilton, Columbia and Nassau Counties. Based on census data, roughly 1.4 million Florida citizens, or about 8% of the state’s population, are currently residing in drought-impacted areas.
Water levels in Lake Okeechobee are still above normal but are continuing on a downward trend since peaking in October. The water elevation by the end of the month was 15.23’, which is about 0.6’ above normal for this time of the year.
Figure 2: Latest U. S. Drought Monitor Map for Florida (from http://droughtmonitor.unl.edu/)
Agriculture-Related Impacts.
At the beginning of January, topsoil moisture levels were at mainly (57%) adequate, although some (23%) short or very short (5%), and some surplus (15%) values were reported across the state. At the end of the month, the proportion of adequate topsoil moisture level was similar (58%) but the proportion of short values increased to 33% and that of surplus values decreased to 7%.
The citrus area experienced below freezing temperatures on several occasions – in some cases dropping down to the mid-20s – but those temperatures were not cold enough for long enough to cause any major problems. Most groves were irrigated, because even though the entire citrus-growing region was drought-free throughout the month, it generally received only light rain.
Hard freezes damaged strawberry and blueberry crops in Bradford and Osceola Counties. Many vegetable producers either covered or heavily harvested their crops ahead of the freezes, or used freeze protection irrigation systems. As a result, most vegetables were largely unscathed by the cold, except for minor damage to some sensitive crops.
Many pastures across the Panhandle and Central Peninsula were damaged by freezing temperatures, and most winter grazing in Holmes County failed. Pasture quality across has been declining with the cold temperatures across the state and drought in much of the Peninsula. Cattle are receiving supplemental feeding and have remained in mostly good condition.
In Lafayette County poultry farmers have reported increased spending on heating fuel needed to keep birds warm, and rye and oat crops have been affected by ice.
Sugarcane harvesting and planting has been largely unaffected by the cold weather, and is proceeding as usual.
Appendix 1: Additional January departures from normal data for Florida locations.
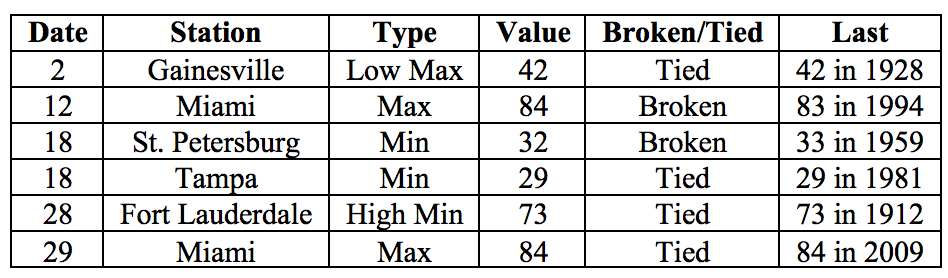
Appendix 2: Select daily maximum and minimum temperature records (° F) broken or tied during January (compiled from NOAA, NWS).