Prepared by Lydia Stefanova, Daniel J. Brouillette, and David F. Zierden.
Florida Climate Center
The Florida State University
Tallahassee, FL

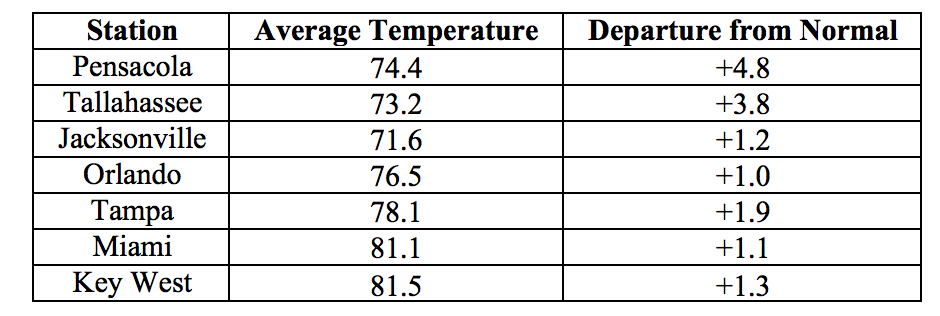
Average temperatures were above normal across most of the state in October. The departures from average temperatures in October 2016 were mostly above normal across the state, ranging from -0.5˚F in Fort Lauderdale to +4.8˚F in Pensacola (Table 1 and Appendix 1). October 2016 was the 5th warmest on record for Miami, 6th for Pensacola, 8th for Tampa, and 9th for Tallahassee. Multiple maximum and minimum temperature records were tied or broken across the state in October (Appendix 2).
Table 1: October average temperatures and departures from normal (˚F) for selected cities.
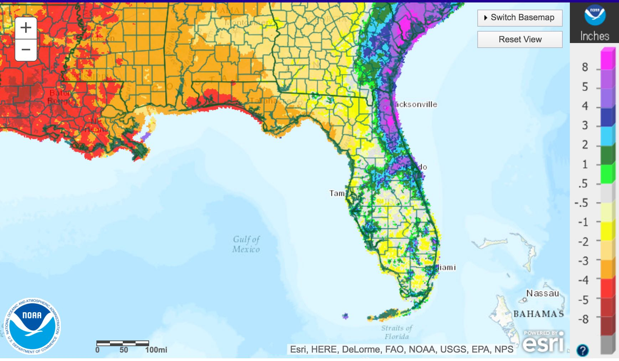
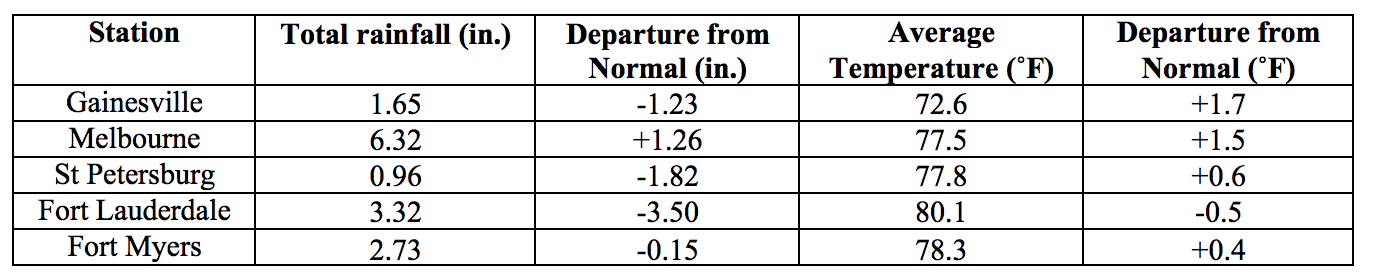
Rainfall totals in October were varied across the state. Most of the Panhandle had much below normal rainfall, while parts of the Peninsula that were affected, particularly along the northeastern coast, had much above normal rainfall (Figure 1). Major reporting stations registered departures from normal ranging from -5.24” in Pensacola to +5.58” in Jacksonville (Table 2 and Appendix 1), although localized parts of the state saw rainfall totals that were over 8” above normal (Figure 1). October 2016 was the 4th driest October on record for Pensacola and the wettest on record for St Augustine. There were a small number of 24-hour precipitation records broken for the month (Table 3).
Table 2: October precipitation totals and departures from normal (inches) for select cities.
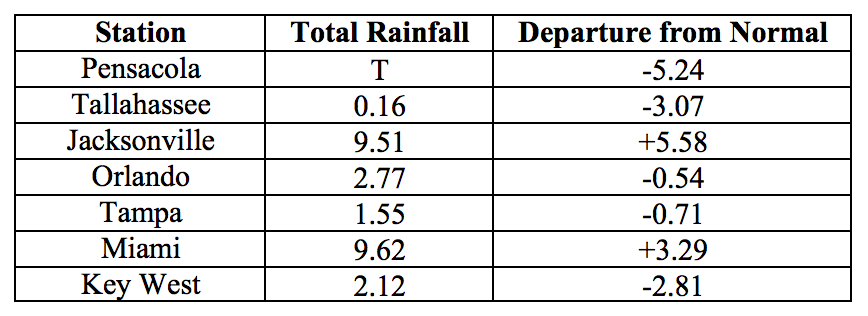
Table 3: Select daily rainfall records (inches) broken during October (compiled from NOAA, NWS).

Figure 1: A graphical depiction of the monthly rainfall departure from normal (inches) for October is given in the figure below (courtesy of NOAA, NWS).
ENSO Alert System Status Set to La Niña Watch.
Based on current data and forecast models, the Climate Prediction Center (CPC) has set the ENSO Alert System at a La Niña watch. ENSO-neutral conditions are currently present, and equatorial sea surface temperatures are below normal across the central and east-central Pacific Ocean. There is an approximately 70% chance that La Niña conditions will continue develop in fall 2016 and are slightly favored to persist into the winter of 2016-2017. CPC predictions favor above normal temperatures and below normal precipitation across the state for November 2016 through January 2017.
Hazardous Weather Events in October.
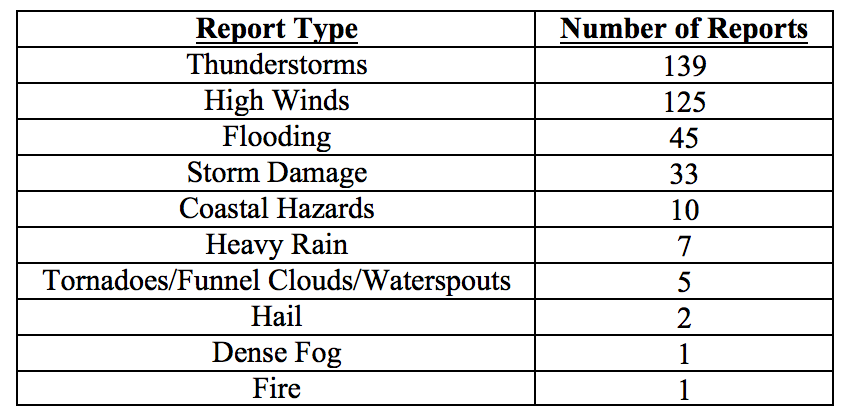
There were a total of 368 severe weather reports made in Florida during October 2016 (see Table 4 for a breakdown by type). Over two-thirds of these reports resulted from the impact of Hurricane Matthew. Hurricane Matthew skirted the Atlantic Coast of Florida between October 6th and 7th as a category 3 storm. It did not quite make landfall, but its eyewall came very close to the coastline (within 10 miles at its closest). Anticipating a more direct hit from the storm, emergency-management officials had collectively called for the largest evacuation in Florida history. Nonetheless, even though Matthew did not make as direct a hit on the state as anticipated, nine Floridians perished as a direct result of the storm, and early estimates put damages in the hundreds of millions of dollars in Florida alone. Despite never making a landfall on the state, Hurricane Matthew had a considerable impact on Florida’s eastern coast, with historically high and damaging storm surge, tropical-storm- to hurricane-force winds, and heavy rains. Matthew produced some very high storm surges, exceeding 5’, in Nassau, Flagler, Duval, and St. Johns Counties. The storm surge flooded near-coastal roadways and structures, especially in the communities of Flagler Beach, Jacksonville Beach, Palm Coast, St. Augustine, and St. Augustine Beach. The surge, along with high waves, severely eroded beaches and dunes and, in some cases, compromised structures and roadways. Hurricane-force wind gusts were registered along and near the Space Coast, and tropical-storm-force sustained winds and gusts were registered at stations throughout the eastern half of the peninsula from near Miami northward. These strong winds caused structural damage that ranged from sporadic and minor in near-coastal southeastern Florida (e.g., a few trees and branches blown down, awnings ripped off buildings) to widespread and more substantial along the Space and First Coasts (e.g., many trees and branches down, building roofs de-shingled, many power lines and poles blown down). At the peak of the storm on the 7th, 1.1 million electric customers had lost electric power statewide. In the city of Jacksonville, widespread power failure caused many sewage lift stations maintained by the Jacksonville Electric Authority (JEA) to be non-operational, leaving the operational ones with an increased demand, which was only increased by run-off from heavy rainfall from the storm. As a result, the JEA was forced to dump 7.4 million gallons of raw sewage into the St. Johns River. Rainfall totals due to Matthew were moderate to high in proximity to the coast from parts of the Treasure Coast northward. The greatest totals were in portions of Duval, St. Johns, Volusia, Putnam, and Flagler Counties. Inland flooding of creeks and low-lying, poorly drained land and roadways was reported in Volusia, northern Brevard, Flagler, St. Johns, Putnam, and Duval Counties. Aside from Matthew’s impacts, mid-month, coastal areas of South Florida, particularly in Miami, Miami Beach, and Fort Lauderdale, experienced flooding from seasonally high astronomical tides (“king tides”). Similar king tides and likely flooding are expected mid-month in November as well. Other reported coastal hazards during October included rip tides off the coast of Palm Beach County on the 16th, leading to one fatality, and off of Jacksonville Beach on the 18th requiring rescue of several swimmers.
Table 4: Breakdown of storm reports submitted in Florida during the month of October (Compiled from Southeast Regional Climate Center.)
Agriculture Related Impacts.
At the beginning of October, topsoil moisture levels were at mainly (67%) adequate, though some (18%) surplus and some (13%) short values were reported across the state. By the end of the month, topsoil moisture levels were still mainly (59%) adequate, but some (20%) short and (13%) very short values were reported. Peanut harvesting was completed at 58% by the first week of October, and at 94% by the end of the month. Peanut harvesting continues in Lafayette, Okaloosa, Walton and Washington Counties, and is hampered by very dry soils in Jackson County. Cotton harvest continues in Lafayette, Okaloosa, Walton, and Washington Counties. Haying was active in Columbia, Dixie, Jackson, Flagler, Okaloosa, Okeechobee, Orange, Pasco, and Volusia Counties, with some setbacks in Pasco County because of the hurricane, and some reported hay loses from flooding in Flagler and Putnam Counties. Pasture quality is seasonally declining across the state but both pasture and cattle conditions are mostly good. In the aftermath of hurricane Matthew, farmers in Putnam and St. Johns Counties reported substantial losses to their crops, averaging 30% to 60%, and a few farmers reported total losses. Recently planted crops of Asian vegetables and snap beans were especially damaged, with losses due to that damage estimated by the University of Florida Agricultural Extension at $1.6 million. Crops of cabbage, cauliflower, broccoli, winter squash, mustard greens, sweet corn, and sweet potatoes were also affected. Farmers blamed flooding and soggy soils from excessive rainfall due to both the hurricane and a stalled surface front just before the time of the hurricane. The citrus growing region had average- to above-average temperatures for the season, with little rainfall aside from that brought on by hurricane Matthew. Towards the end of the month, most groves were being irrigated to offset the lack of rain in the later weeks. Harvesting of all citrus varieties is lagging behind last year’s schedule.
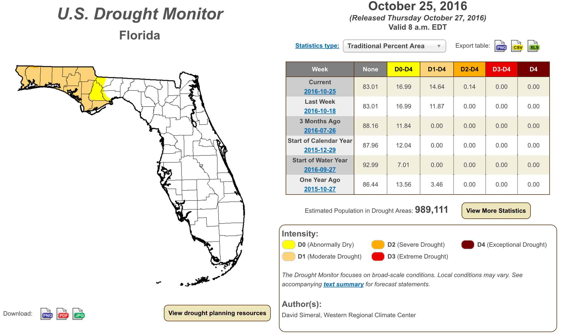
Drought Related Impacts.
At the beginning of October, the most (93%) of the state was drought free, and 7% of the of the state (including portions of Nassau, Duval, St Johns, Putnam, Volusia, Seminole, Orange and Brevard Counties on the east coast, as well as northern Okaloosa and small portions of northern Santa Rosa, Walton and Jackson Counties in the panhandle) were experiencing abnormally dry (D0) conditions. Rains from the passage of hurricane Matthew removed the abnormally dry conditions from the entire east coast of the state by the 8th. At the same time, lack of rain and relatively high temperatures lead to D0 conditions setting in the western Panhandle. As the month progressed, these dry conditions intensified. As of the last US Drought Monitor report (released on Oct 27th), moderate drought (D1) conditions are extending over most of the western Panhandle, from Escambia County at the west to Jackson, Calhoun, Gulf and Franklin Counties at the east. Severe drought (D2) has set in the extreme northern portion of Santa Rosa County. D0 conditions are present in Liberty and Gadsden Counties, and in western Wakulla County. In all, 83% of the state was classified as drought-free, approximately 2% as D0, and approximately15% as D1. D2 conditions are affecting less than 0.2% of the state’s area. In all, drought conditions are currently affecting close to one million Florida citizens. The water level in Lake Okeechobee at the end of the month was at about 15.4 ft., down from the beginning of the month but still slightly higher than the average level for this time of the year.
.
Appendix 1: Additional October departures from normal data for Florida locations.
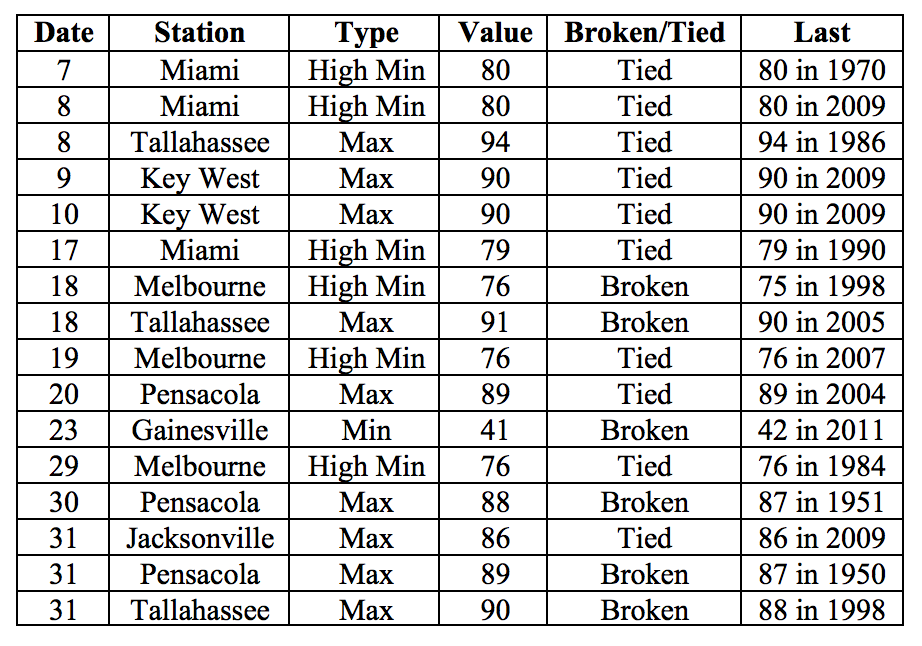
Appendix 2: Select daily maximum and minimum temperature records (° F) broken during October (compiled from NOAA, NWS).