Chances continue to lessen for the development of El Niño in late summer or fall.
Evolution of Sea Surface Temperatures
Back in mid-March through June, sea surface temperatures along the equator in the Pacific Ocean warmed significantly in response to a strong downwelling Kelvin wave. The eastern and central equatorial Pacific warmed to the point where the Niño 3.4 index reached the 0.5 C threshold for El Niño conditions in May and June.
In spite of the fact that Nino 3.4 had reached the 0.5 C threshold, NOAA held off in declaring that "El Niño conditions" were here in their monthly advisory issued July 10.
http://www.cpc.ncep.noaa.gov/products/analysis_monitoring/enso_advisory/ensodisc.html
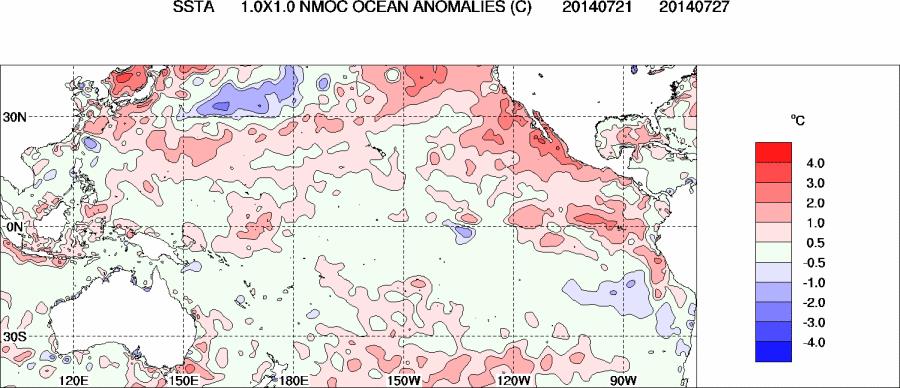
In the past few weeks, however, sea surface temperatures have cooled to the point where the Niño 3.4 index has actually turned negative in the last week (-0.1 C).

SST anomalies over the past week in degrees C (courtesy Australia BOM).
Westerly Winds and Kelvin Waves
El Niño’s usually form when disruptions in the normal easterly trade winds over the western and central Pacific Ocean result in episodes of unusual westerly in winds, or at least westerly anomalies. These westerly wind episodes can excite a downwelling Kelvin wave, which deepens the warm mixed layer (a couple hundred meters deep) and thermocline as it travels across from the western Pacific along the equator to reach the shores of South America. It takes these Kelvin waves a couple of months to cross the Pacific.
Once the thermocline has been deepened in the central and eastern Pacific, surface warming occurs as the usual upwelling of cold water has been shut off.
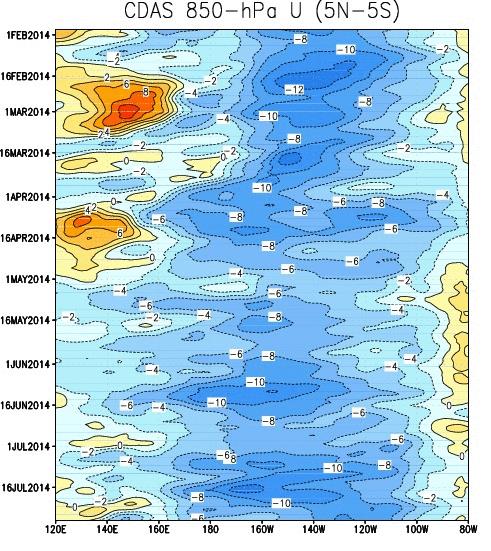
In January through mid-April, we witnessed three distinct westerly wind episodes that triggered a very strong Kelvin wave. The graphic below shows a time-longitude representation of near-surface winds along the equator.

850 mb zonal wind component time-longitude section.
The strong westerly wind episodes centered around March 1st and April 15th are clearly visible in the top left of the graph. However, there have been no similar westerly winds since mid-April.
The next graphics show an equatorial cross section of ocean temperature anomalies at depth for mid-April and again over the last week. In the mid-April graph, ocean temperatures are over 5.0 C warmer than normal at a depth of 100 meters or so in response to the massive Kelvin wave. In the current graph on the right, colder than normal waters have now replaced the subsurface warming in much of the central and eastern Pacific.

Subsurface temperature anomalies for mid-April (left) and late July (right).
In 1997, by June the atmosphere had strongly coupled with the ocean and the warm SST's were now driving strong westerly winds across most of the equatorial basin. It's very clear now that we will not have a repeat of 1997/1998.
Atmosphere not responding to sea surface temperatures
The problem is that at the atmosphere has not coupled with the sea surface temperatures like during a full-blown El Nino and that coupling was needed for this event to continue to grow during the late summer/fall. During a maturing El Niño, the unusually warm water in the eastern Pacific starts to affect sea level pressure, convection, and surface winds, causing more reinforcing westerly wind episode that excite additional Kelvin waves.
Sea level pressure differences (as usually tracked by the SOI) have been mostly positive in May and June after being strongly negative in early April. Cloudiness near the dateline has also returned to normal as measured by satellite outgoing longwave radiation. Most importantly, we have not had any significant westerly wind anomalies since early April and these winds are the real drivers of ocean temperature changes.
What does all this mean…?
Bottom line - the impacts of the strong Kelvin wave that just finished crossing the Pacific in April are fading quickly and it takes more than one of these Kelvin waves to sustain a full-blown El Niño. Current subsurface temperatures are no longer strong enough to support further development of El Niño. The atmosphere will need to get its act in gear for this event to grow stronger.
Most of the El Niño prediction models are still favoring a weak to moderate El Niño, but the predicted strength has come down from the predictions made in mid-April.
In the latest weekly update, the Australia Beaureau of Meteorology dropped the likelihood of El Niño developing this summer or fall to 50%.
http://www.bom.gov.au/climate/enso/
In NOAA’s monthly El Niño forecast issued on July 10th, they kept the chance of development at 70% for summer and 80% for fall and winter. We have been under an “El Niño watch” since March, meaning it is likely that El Niño will develop in the next several months. However, it will be interesting to see if NOAA lowers these chances in the next monthly update.
http://www.cpc.noaa.gov/products/analysis_monitoring/enso_advisory/ensodisc.html
If sea surface temperatures rebound and an El Niño does develop, it is now nearly certain that it will not be a strong one as in 1997. Weak to moderate in strength is the best we can hope for.
With current surface and subsurface temperatures and lack of response in the atmosphere, the chances are lowering that El Niño will even develop at all. The same thing happened in the summer of 2012, where sea surface temperatures warmed rapidly in the summer months, then returned to normal in the fall and winter.

