Sea Level Rise and Coastal Risk
- Global Sea Level Change
- Historical Trends in Sea Levels
- Sea Level Rise Projections
- Sea Level Rise Impacts
Download report in PDF format  or read the report below.
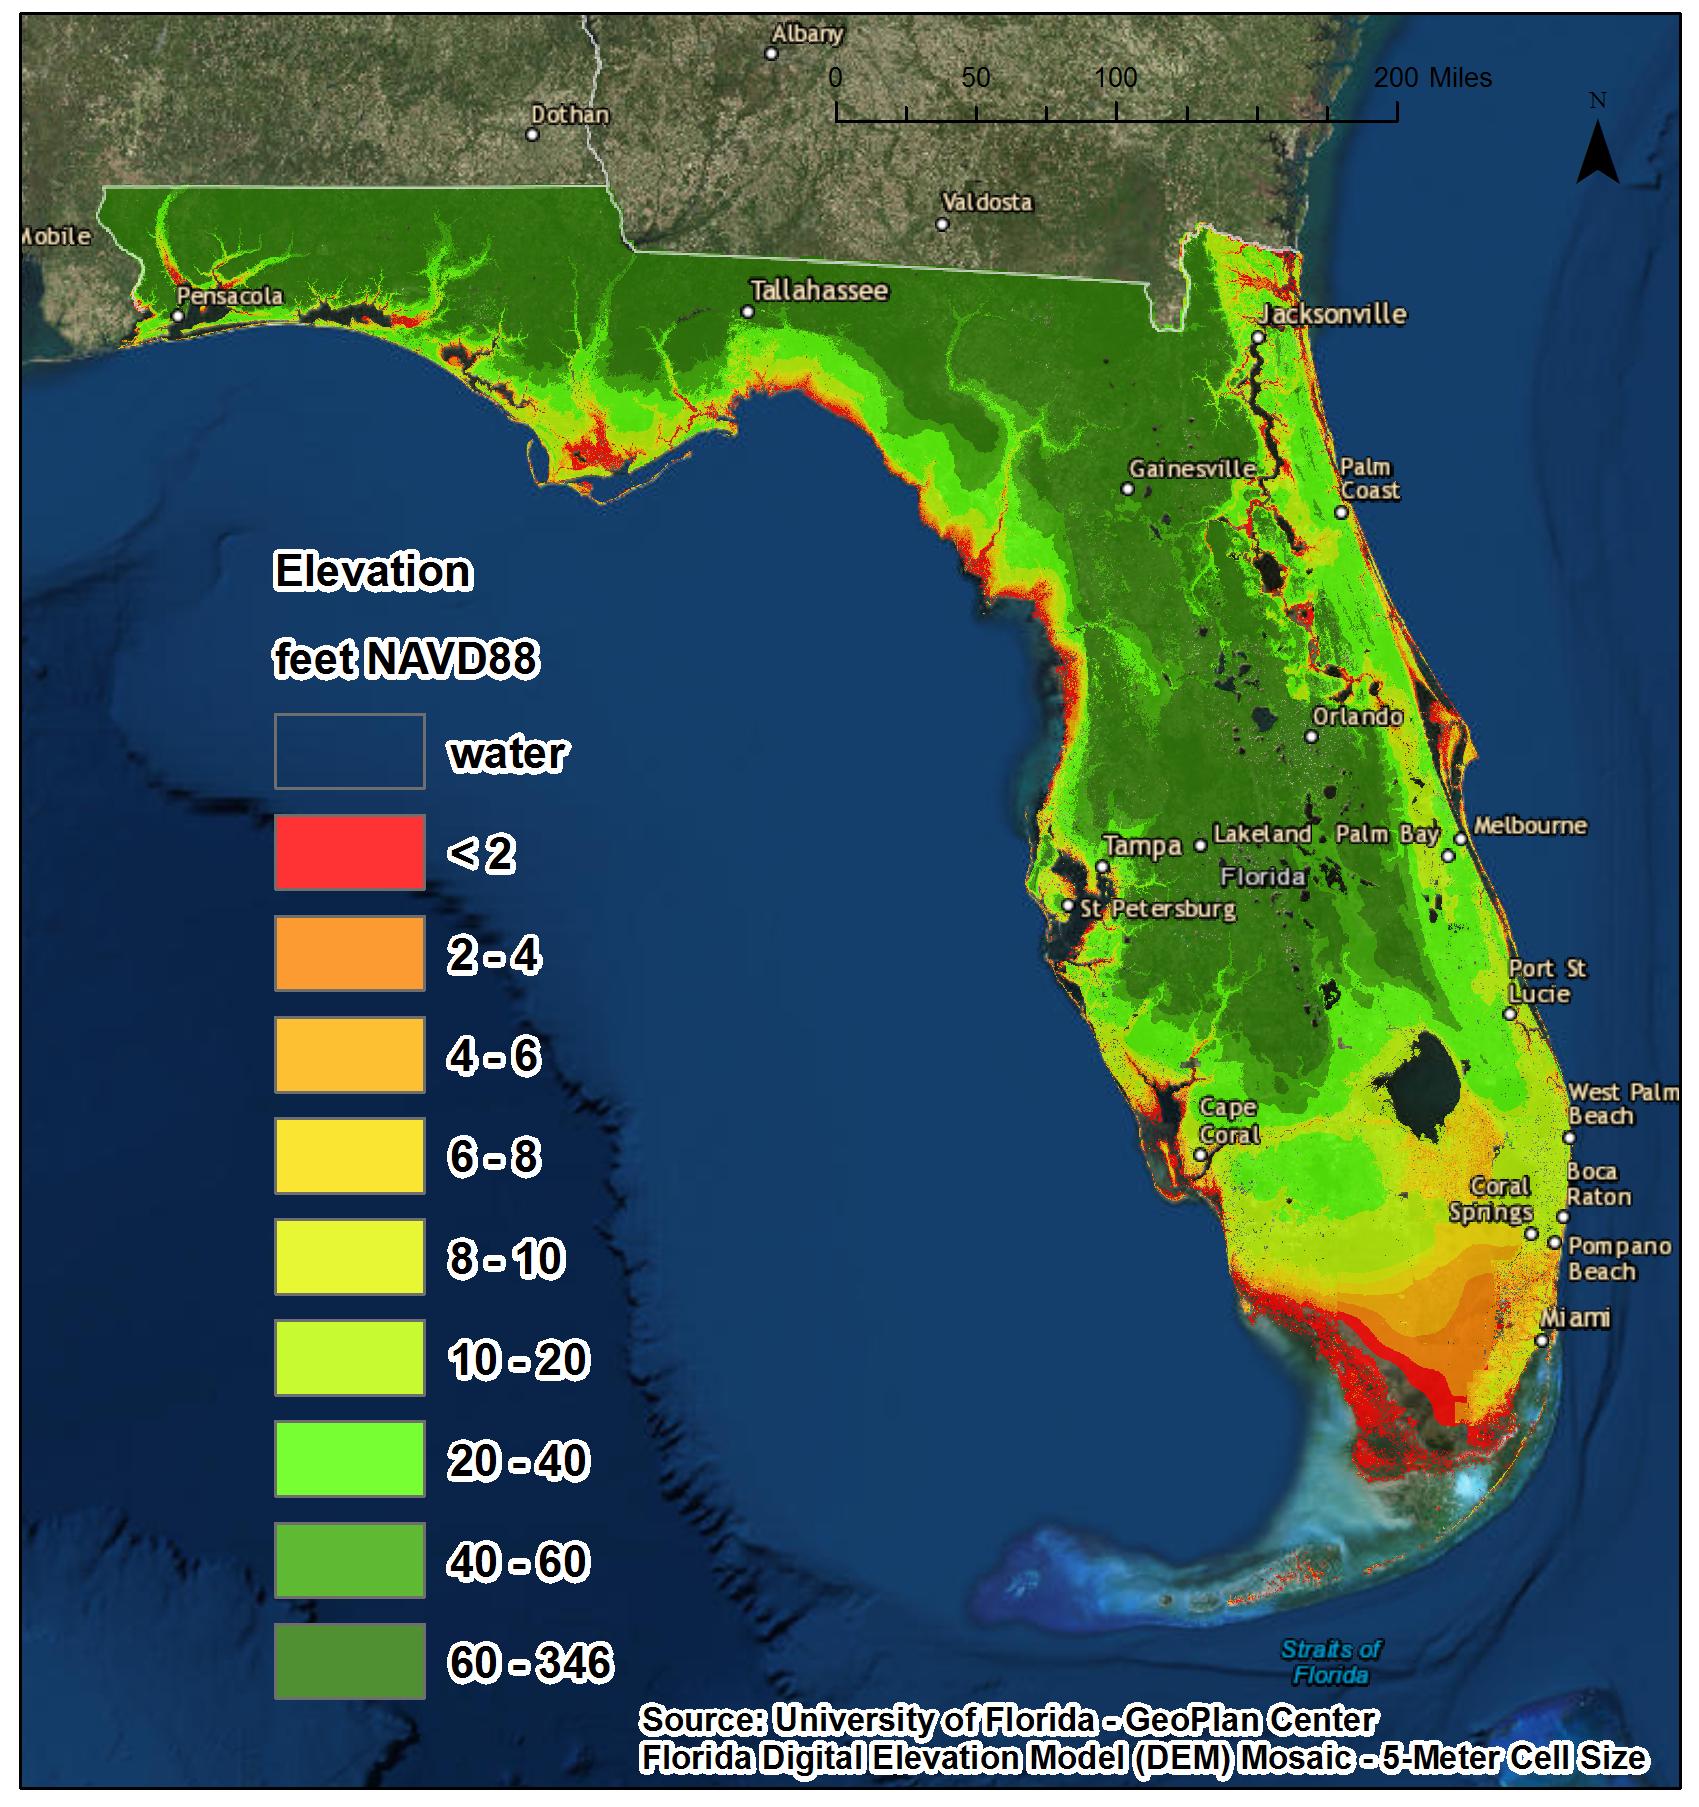
Florida is among the most exposed states in the country to sea level rise and coastal storms. With its low-lying coastal topography and more than 8,400 miles of shoreline, much of Florida and its coastal population are vulnerable to the impacts of rising sea levels. While vulnerability to sea level rise varies considerably across the state, with many inland areas at much higher elevations, sea level rise impacts will not be restricted to areas along the immediate coast.
|
||||||||||||||||||||||||||||||||||||||||||||||||||||||||||||||||||
|
Figure 1. Composite Digital Elevation Model (DEM) of Florida, in feet NAVD88. Source: South Florida Regional Council report (2016). Global Sea Level ChangeGlobal mean sea level rose rapidly following the last ice age approximately 20,000 years ago. However, the rate of sea level rise slowed and has been nearly stable over the last few thousand years. Since around 1900, global average sea level has risen by about 7-8 inches (Hayhoe et al. 2018, NCA4) and the rate of sea level rise has been accelerating in recent decades as ocean temperatures warm. Nearly half of this rise in sea levels has occurred since 1993, and the rate of global mean level rise since 1993 has been approximately 3.4 mm per year. It is virtually certain that global mean sea levels will continue to rise throughout the 21st century and beyond. The main contributors to changes in global mean sea level are thermal expansion caused by warming ocean temperatures, melting of land-based ice that results in the addition of fresh water into the ocean, and local land water storage (e.g., water that is pumped from land or impounded by dams or other structures). Sea level rise can vary across the coast due to ocean currents and tidal fluctuations. Data on sea level changes come from multiple sources, primarily from tide gauges, coastal buoys, and satellite altimeters. Models are also used to estimate changes in sea levels, particularly where no data are available. Relative sea level rise (RSLR) is the combination of global mean sea level rise and local or regional changes in sea levels that occur due to land movements and other factors. Sea levels vary regionally as a result of vertical land movements (such as land subsidence or isostatic rebound), the ocean’s circulation, temperature and saltiness (called sterodynamic variability), and local gravitational changes due to ice melt from glaciers and ice sheets. Across the northern U.S. Gulf Coast, the rate of relative sea level rise is greater than the global average largely due to land subsidence, where the land is sinking due to physical and human activities. Conversely, in Alaska the land is rising in a process called isostatic rebound, which is the uplift of land that was once covered in ice during the last ice age and is now rebounding as the weight of that ice is removed. In those areas, relative sea levels are decreasing because the vertical lifting of the land has been greater than the rate of global mean sea level rise. While global mean sea level changes provide an important measure of a warming climate, it is changes in the RSLR that are most important for understanding impacts along the coasts.
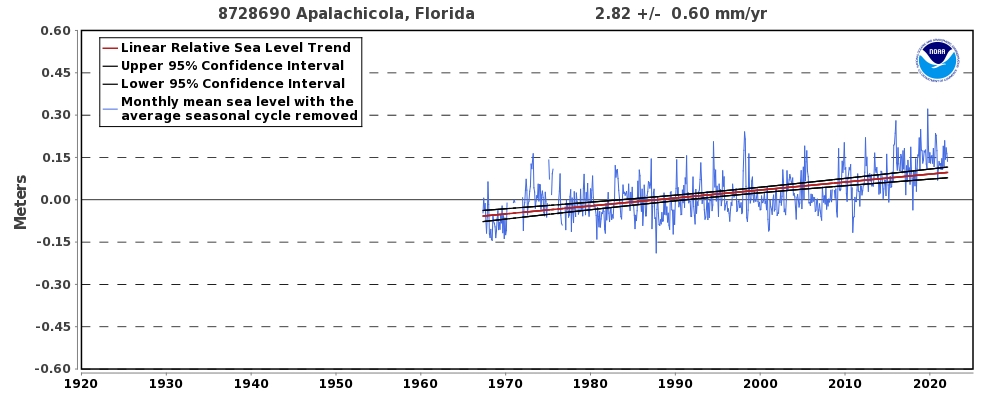
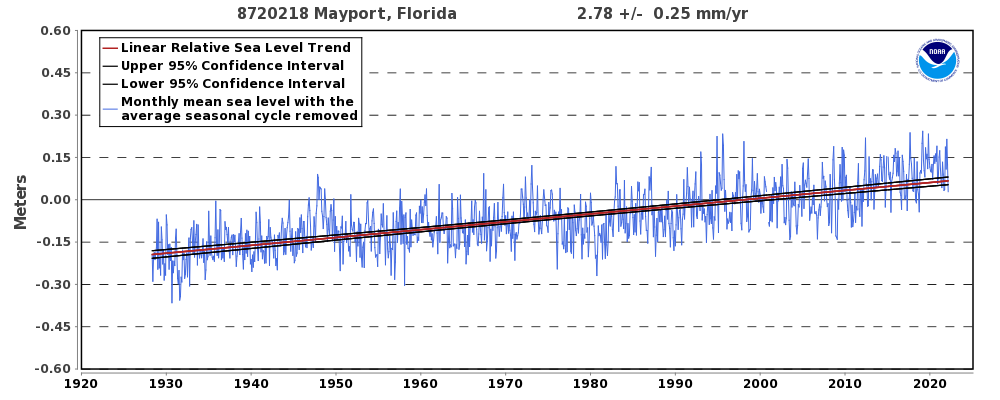
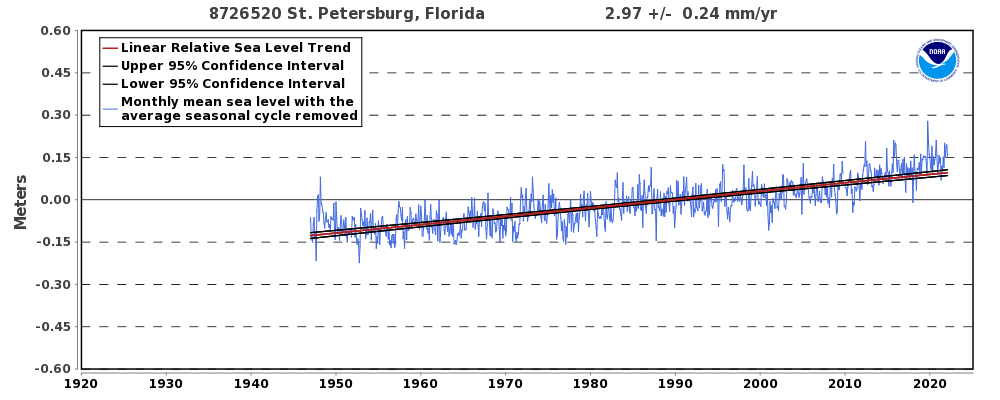
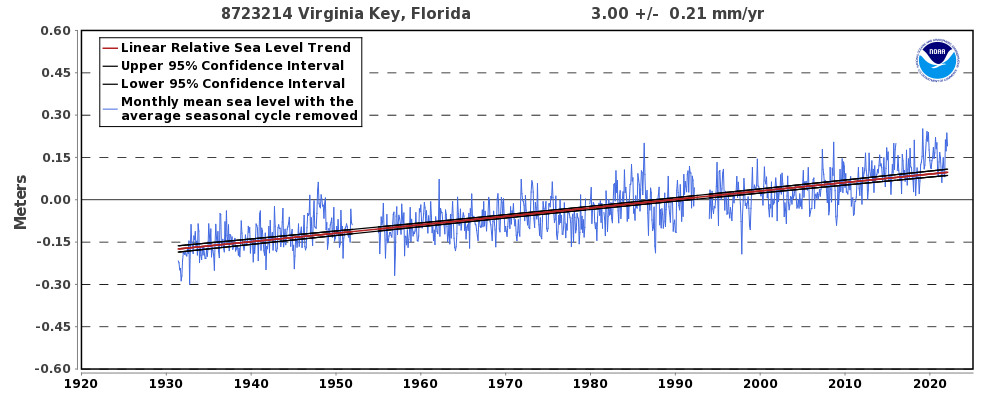
Historical Trends in Sea LevelsSatellite altimetry data indicate that the average rate of sea level rise in the Southeast U.S. region has been about 3.0 mm (0.12 inches) per year since the early 1990s, which is roughly equal to the global rate of sea level rise. Sea levels across Florida are as much as 8 inches higher than they were in 1950, and the rate of sea level rise is accelerating. For instance, sea levels around Virginia Key have risen by 8 inches since 1950, but they have been rising by 1 inch every 3 years over the past 10 years, based on tide gauge data. This acceleration in sea level rise is projected to continue. In the same area around Miami, sea levels increased 6 inches over the last 31 years, from 1985 to 2016, but they are expected to rise another 6 inches in half that time, over the next 15 years, according to the U.S. Army Corps of Engineers high scenario projections. The graphs below show relative sea level trends from tide gauges around Florida’s coasts, from north to south. Each relative sea level trend is shown with the 95% confidence intervals and values are relative to the most recent mean sea level datum. The linear trend lines are also shown (in red). Note that the period of record for each tide gauge varies. Click on each graph to view a larger image.
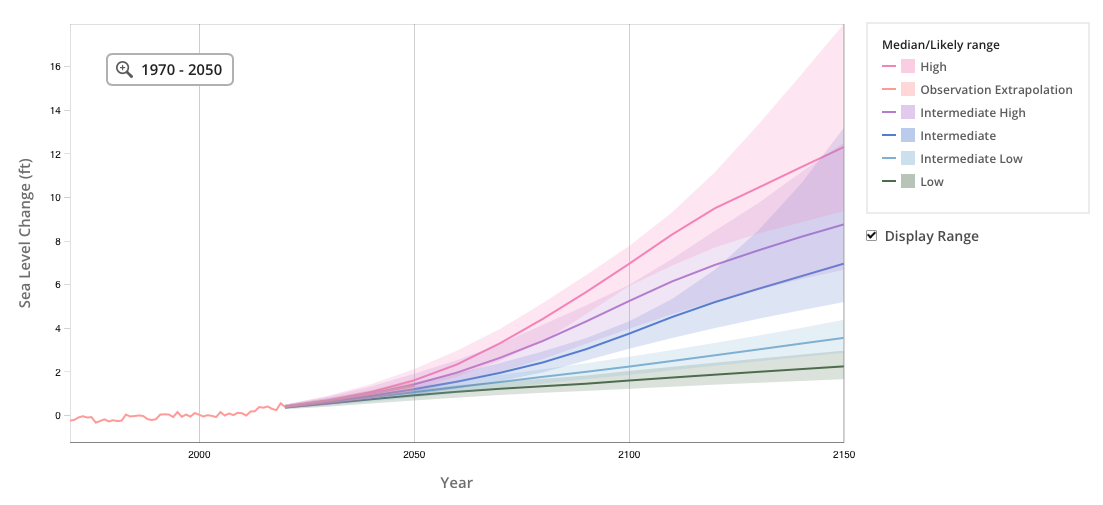
Future Sea Level RiseIt is virtually certain that global mean sea levels will continue to rise throughout the 21st century and beyond. According to the latest science on sea level rise projections for the United States (Sweet et al. 2022), sea level rise over the next 30 years along the U.S. coastline is projected to be 10-12 inches (0.3 – 0.4 inches per year), on average, which will be as much as what has been measured over the past 100 years from 1920 to 2020. This is an indication of the acceleration in the rate of sea level rise that is expected to continue. Confidence in relative sea level projections in the near term, out to the year 2050, has increased. Beyond 2050, sea level rise projections increasingly depend on the amount of greenhouse gas emissions, global temperature increases, and ice sheet melt in Antarctica and Greenland, making long-term sea level rise projections beyond 2050 less certain. Projections in the relative sea level rise along the contiguous U.S. coastline range from 1.96 – 7.22 ft (0.6–2.2 m) by the year 2100 and 2.62 – 12.8 ft (0.8–3.9 m) by the year 2150, relative to sea levels in 2000. However, not all areas will experience the same amount, or rate, of sea level rise due to changes in local land and ocean heights. Shown below are regional sea level change time series graphs for the eastern Gulf Coast (Fig. 6) and Southeast Coast (Fig. 7). Projections are based on 5 sea level rise scenarios: low, intermediate-low, intermediate, intermediate-high, and high, out to the year 2150. Median values are provided for each scenario, along with likely ranges represented by shaded regions showing the 17th-83rd percentile ranges. For comparison to the model-based scenarios and as an additional line of evidence, extrapolations of available tide gauge observations are also provided. Rates and accelerations are estimated from tide gauge observations from 1970 to 2020 and then extrapolated to 2050. All values are relative to a baseline year of 2000. These graphs are from the Interagency Sea Level Rise Scenario Tool, based on data from Sweet et al. 2022. The table below provides the RSLR projections for coastal locations in Florida under two RSLR scenarios for the years 2050 and 2080, also from the 2022 Sea Level Rise Technical Report (Sweet et al. 2022).
Sea Level Rise ImpactsSea levels are rising globally as a result of ocean warming and land-based ice melt; however, local coastal vulnerability and risk are driven by the total water level experienced at a given location based on the interaction of rising sea levels with astronomical tides, storm surges, and ocean waves, as well as with coastal infrastructure and population. In Florida, sea level rise is already exacerbating saltwater intrusion and impacting groundwater supplies. Sea level rise is impacting gravity-flow drainage infrastructure, which is leading to more frequent and severe high tide (or “nuisance”) flooding. Higher sea levels can also lead to higher storm surge levels and greater coastal flooding during tropical cyclones. To summarize, scientists are confident that sea levels will continue to rise over the coming decades. There is increasing confidence in near-term projections in sea level rise out to the year 2050, but greater uncertainty remains for long-term projections out to the end of this century. Coastal communities across the state are already seeing the impacts from rising sea levels and are taking steps to address these impacts. In some places, sea level rise threatens to disrupt daily life, such as where increased street flooding with saltwater can impact people, infrastructure, and vehicles. As sea level rise continues and accelerates, greater adaptation actions will be needed to minimize impacts and prepare communities for increased flood risks.
| ||||||||||||||||||||||||||||||||||||||||||||||||||||||||||||||||||