Prepared by Florida Climate Center
The Florida State University
Tallahassee, FL

Key Points:
- Average temperatures in July were near or above normal for the month.
- Drought conditions improved in July across Florida; however, small areas of northern Florida continued to experience abnormally dry conditions throughout the month.
- La Niña conditions are favored to continue into early fall, with a 68% chance August-October 2022; the chances of La Niña increase in fall and early winter to a 63-70% likelihood.
- The tropics were quiet in July, but we are entering the peak of the Atlantic Basin hurricane season over the next couple of months.
Average temperatures in July were about normal or above normal across Florida. Average temperature departures from normal ranged from -0.3 ̊F in Key West to +2.5 ̊F in Tampa for the month (see Table 1 and Appendix 1 for select cities). Jacksonville Beach, Tampa, and Plant City had their hottest Julys on record, and Orlando and Fort Lauderdale recorded their 2nd-hottest Julys on record. While Key West was near normal, it broke many daily high maximum and minimum temperature records throughout the month (see appendices 2 and 3 for select daily high maximum and minimum records).
Table 1. July average temperatures and departures from normal ( ̊F) for selected cities.
| Station | Mean Temperature | Departure from Normal |
| Pensacola | 83.5 | 0.0 |
| Tallahassee | 82.3 | -0.2 |
| Jacksonville | 82.6 | +0.1 |
| Orlando | 84.8 | +2.2 |
| Tampa | 86.3 | +2.5 |
| Miami | 84.7 | +0.6 |
| Key West | 85.1 | -0.3 |
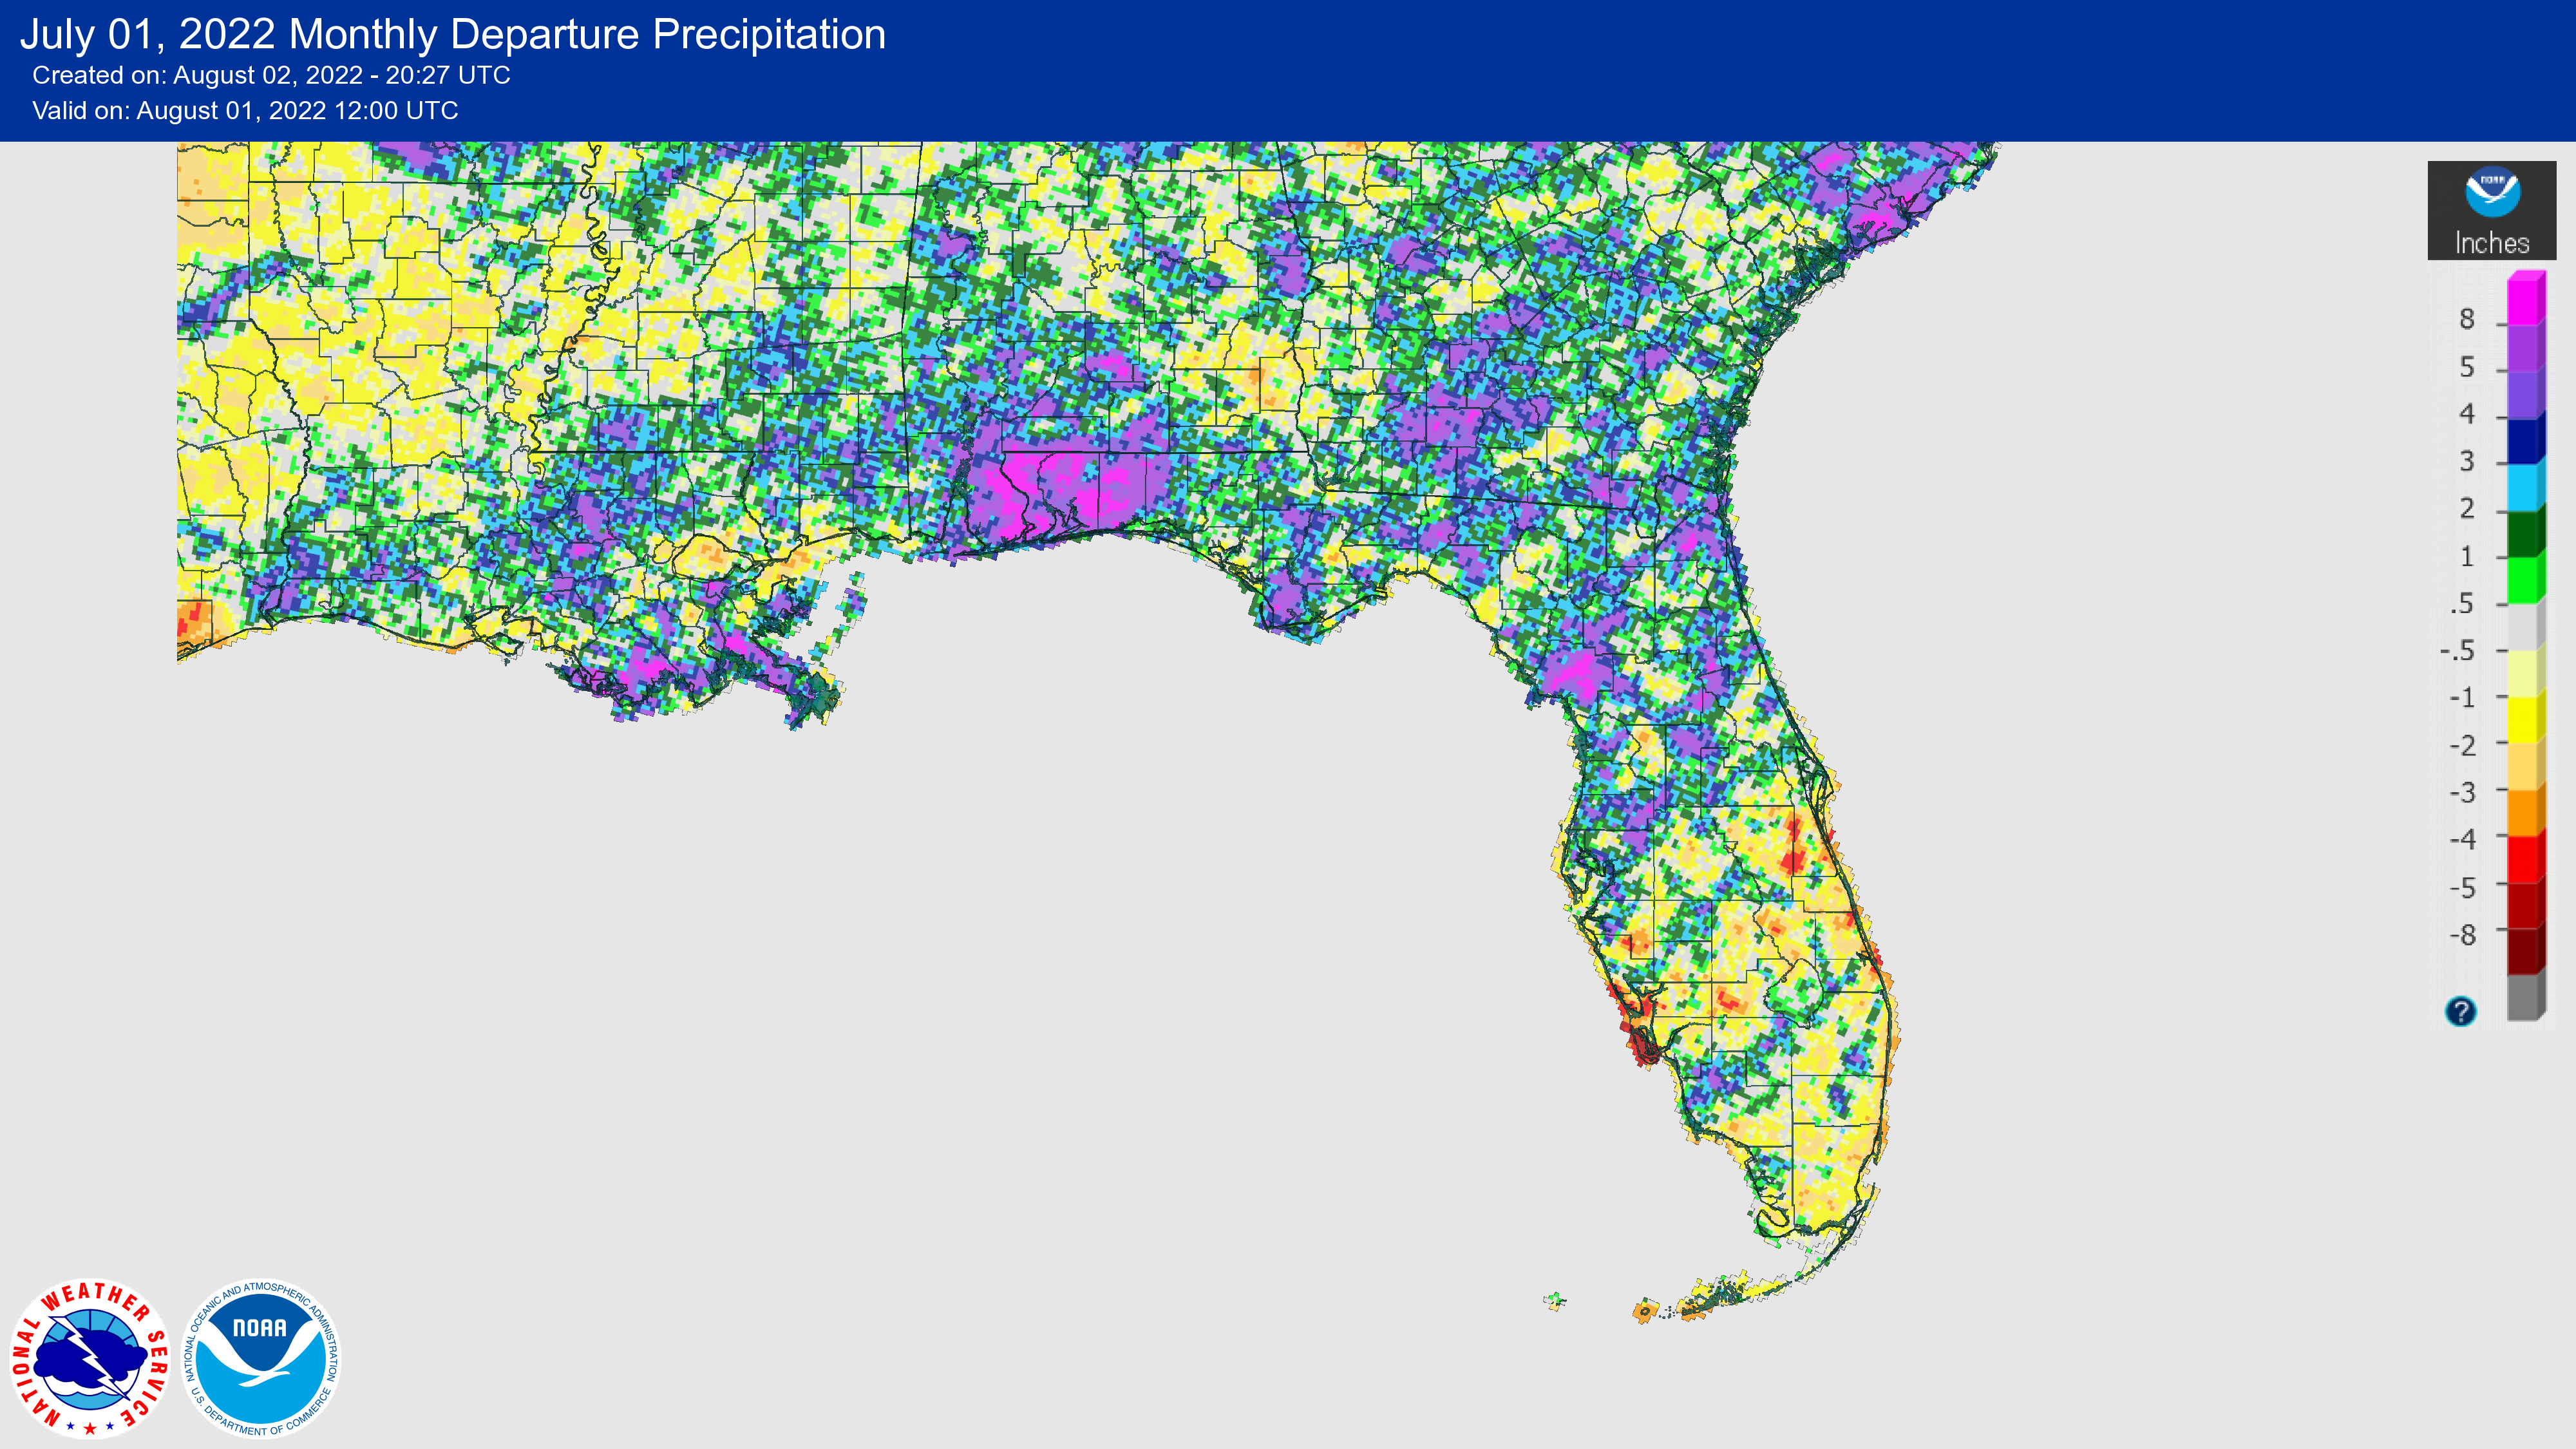
Rainfall totals in July were variable but generally above normal across the Panhandle and north Florida, and below normal in much of south Florida. The monthly precipitation departures from normal ranged from -4.53 inches in Melbourne to +5.86 inches in Tallahassee (Table 2 and Appendix 1). Ample rain fell across portions of northern Florida due to unsettled weather, with roughly 65% and 74% of the month with measurable rain in Pensacola and Tallahassee, respectively. Jacksonville had its 7th-wettest July on record. Conversely, a deficit of rain fell across southeastern and central Florida. This was the 3rd-driest July on record at Fort Pierce and Fort Lauderdale.
Table 2. July precipitation totals and departures from normal (inches) for selected cities.
| Station | Total Rainfall | Departure from Normal |
| Pensacola | 11.17 | +3.28 |
| Tallahassee | 13.00 | +5.86 |
| Jacksonville | 9.95 | +3.18 |
| Orlando | 4.91 | -2.55 |
| Tampa | 11.99 | +4.24 |
| Miami | 4.81 | -2.55 |
| Key West | 2.37 | -1.26 |
Figure 1. A graphical depiction of the monthly rainfall departure from normal (inches) for July (courtesy of NOAA, NWS).
La Niña Advisory.
La Niña is still favored to continue through 2022. By mid-July, sea surface temperatures in the central-eastern equatorial Pacific remained below average. La Niña conditions are expected to persist into the late Northern Hemisphere summer and early fall (68% chance August-October 2022). The chances for La Niña to continue into the Northern Hemisphere fall and early winter increase to a 63-70% likelihood. This will likely be the third year in a row with La Niña, which has only happened twice in the past ~70 years.
Hazardous Weather Events in July.
According to the Local Storm Reports issued by the local National Weather Service offices serving Florida, there were 297 individual local reports of hazardous weather events recorded across the state during the month of July (see Table 4 for a breakdown by event type). Thunderstorms and ample rainfall affected much of northern Florida throughout the month, with monthly rainfall totals over 10 inches in many places. A lightning strike resulted in a fatality in New Smyrna Beach on the 19th. While several waterspouts were reported, there were no tornado reports this month and there was no tropical activity in the Atlantic Basin. There are on average 7 tornadoes reported in Florida during July, based on climatology (1991-2010). While the tropics were quiet, we are on pace with the climatological average for hurricane season and are now entering the peak Atlantic Hurricane Season over the next couple of months.
Table 4. Breakdown of storm reports submitted in Florida during the month of July (compiled from Iowa State University/Iowa Environmental Mesonet).
| Report Type | Number of Reports |
| Flash Flood | 5 |
| Heavy Rain | 21 |
| Flood | 19 |
| Hail | 18 |
| Lightning | 10 |
| Marine Thunderstorm Wind | 60 |
| Non-Thunderstorm Wind Gust | 2 |
| Non-Thunderstorm Wind Damage | 0 |
| Tornado/Waterspout/Funnel Cloud | 0/18/4 |
| Thunderstorm Wind Damage | 28 |
| Thunderstorm Wind Gust | 105 |
| Rip Currents | 4 |
| Wildfire | 3 |
| Tropical Storm | 0 |
Daily Record Events in July.
Table 5.Summary of daily records broken or set in Florida in July (source: NCEI Daily Weather Records).
| Category | Number of Records |
| Highest daily max. temp. | 34 |
| Highest daily min. temp. | 45 |
| Lowest daily max. temp. | 9 |
| Lowest daily min. temp. | 11 |
| Highest daily precipitation | 28 |
| Total | 127 |
Weather/Climate Highlight of the Month.
Tropical Strom Colin was the only tropical system that formed in July (July 2-3) in the Atlantic Basin, which impacted the coastal Carolinas before moving out into the open ocean. It was a small, surprise storm that did not produce much rain. Maximum winds were around 40 mph. This was the third named storm of the season and occurred ahead of the climatological average for the Atlantic hurricane season.
Drought-Related Impacts.
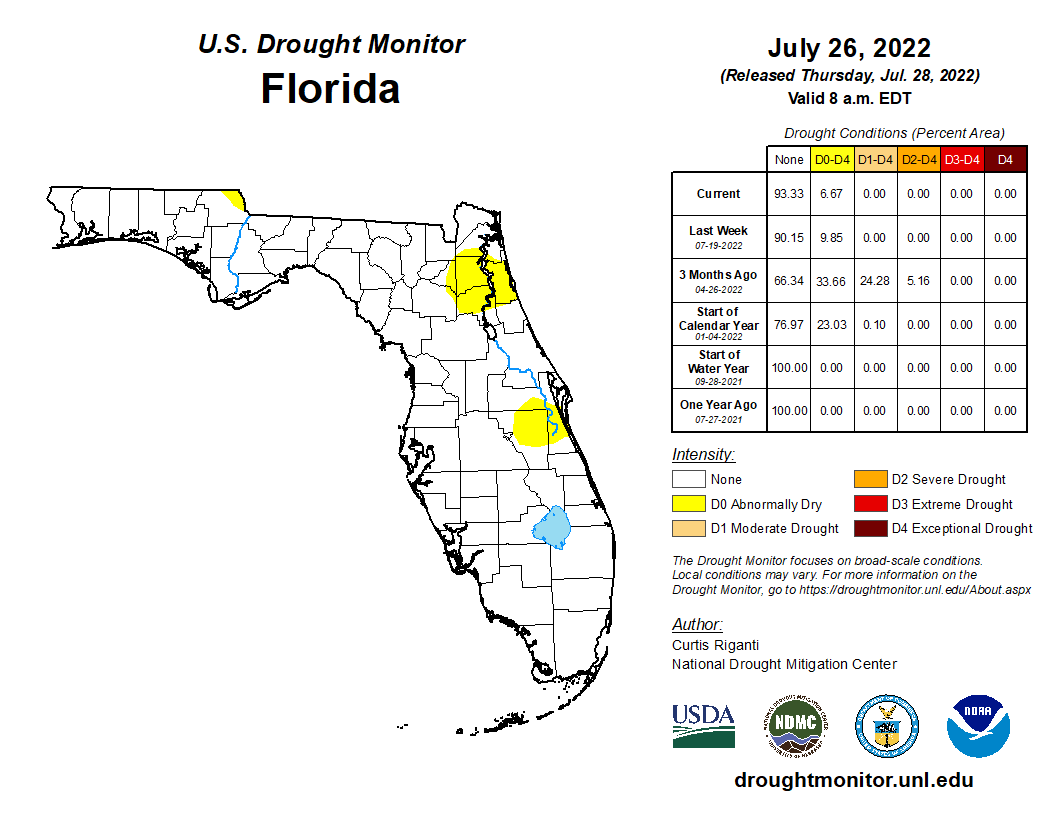
At the beginning of July, 23.5% of the state was experiencing abnormally dry conditions (D0), according to the U.S. Drought Monitor. Abnormally dry conditions steadily improved throughout the month, and as of July 26, only 6.7% of the state was in abnormally dry conditions (Figure 2 below).
As of July 31, the Lake Okeechobee water level was 12.96 ft. above sea level (Feet-NGVD29), which is below average for this time of the year. The water level remained below average throughout the month. At the first of the month, the water level was 12.90 ft. above sea level.
Figure 2. A graphical depiction of the current drought conditions in Florida according to the U.S. Drought Monitor (courtesy of the National Drought Mitigation Center, University of Nebraska-Lincoln).
Agriculture-Related Impacts.
During mid-July, topsoil moisture conditions were adequate in 84% of the state, short in 6%, and very short in 1% of the state, while 9% of the state had surplus moisture conditions. Near the end of July, topsoil moisture had declined somewhat with levels adequate in 79% of the state, short in 13%, and very short in 1% of the state; 7% of the state was in surplus. For more information, consult the Crop Progress and Conditions report, which is published by the USDA's National Agricultural Statistics Service.
Appendix 1
Additional July departures from normal data for select Florida locations (Source: NWS).
| Station | Average Temperature (˚F) | Departure from Normal (˚F) | Total Rainfall (in.) | Departure from Normal (in.) |
| Gainesville | 82.4 | +1.0 | 10.09 | +3.41 |
| Sarasota | 83.5 | +0.4 | 5.80 | -1.59 |
| Melbourne | 83.5 | +0.4 | 1.97 | -4.53 |
| Fort Myers | 85.3 | +2.1 | 9.52 | +0.14 |
| West Palm Beach | 85.4 | +2.3 | 2.00 | -3.63 |
Appendix 2
Select daily record high maximum temperatures broken or tied during July (compiled from NOAA).
| Location | Date | Record (˚F) | Broken/Tied | Last |
| Key West | 1 | 96 | Broken | 95 in 2019 |
| Key West | 3 | 95 | Broken | 93 in 2020 |
| Jacksonville Beach | 4 | 97 | Tied | 97 in 1978 |
| Key West | 4 | 96 | Broken | 95 in 2020 |
| Key West | 5 | 96 | Broken | 94 in 2020 |
| Clermont | 6 | 99 | Broken | 98 in 2019 |
| Plant City | 8 | 98 | Tied | 98 in 1969 |
| Key West | 8 | 96 | Broken | 95 in 2020 |
| Orlando | 9 | 97 | Tied | 97 in 1992 |
| Daytona Beach | 9 | 97 | Tied | 97 in 2010 |
| Vero Beach | 10 | 97 | Broken | 96 in 1995 |
| Key West | 11 | 96 | Broken | 94 in 2020 |
| Kissimmee | 13 | 99 | Broken | 98 in 1981 |
| Orlando | 13 | 99 | Broken | 98 in 1937 |
| Plant City | 14 | 99 | Tied | 99 in 1916 |
| Key West | 14 | 95 | Broken | 94 in 2020 |
| Key West | 17 | 95 | Broken | 94 in 2019 |
| Orlando | 18 | 97 | Tied | 97 in 1983 |
| Key West | 18 | 98 | Broken | 93 in 2021 |
| Key West | 19 | 97 | Broken | 93 in 2019 |
| Key West | 20 | 96 | Broken | 93 in 2021 |
| Orlando | 21 | 96 | Broken | 95 in 2012 |
| Clermont | 22 | 98 | Broken | 97 in 2021 |
| Key West | 22 | 95 | Broken | 94 in 2011 |
| Key West | 24 | 97 | Broken | 94 in 2011 |
| Key West | 25 | 96 | Broken | 94 in 2011 |
| Tampa | 29 | 97 | Tied | 97 in 1993 |
| Canal Point | 30 | 96 | Broken | 95 in 2017 |
| Tampa | 30/td> | 97 | Broken | 96 in 1961 |
| Plant City | 31 | 99 | Tied | 99 in 2019 |
| Tampa | 31 | 97 | Broken | 96 in 1958 |
Appendix 3
Select daily record high minimum temperatures broken or tied during July (compiled from NOAA).
| Location | Date | Record (˚F) | Broken/Tied | Last |
| Key West | 1 | 87 | Broken | 84 in 2019 |
| Perrine | 2 | 78 | Broken | 77 in 2006 |
| Key West | 2 | 87 | Broken | 86 in 2019 |
| Key West | 4 | 86 | Broken | 85 in 2019 |
| Fort Lauderdale | 5 | 80 | Tied | 80 in 2017 |
| Mayport | 5 | 78 | Tied | 78 in 2007 |
| Tampa | 5 | 81 | Tied | 81 in 2016 |
| Lakeland | 5 | 77 | Broken | 76 in 1995 |
| Fort Pierce | 6 | 80 | Broken | 79 in 1934 |
| Hastings | 6 | 77 | Broken | 76 in 2017 |
| Melbourne | 6 | 79 | Tied | 79 in 2011 |
| Stuart | 6 | 80 | Tied | 80 in 1967 |
| Marianna | 7 | 76 | Broken | 75 in 2017 |
| Key West | 8 | 87 | Broken | 84 in 2007 |
| Tallahassee | 8 | 78 | Broken | 76 in 2016 |
| Chipley | 9 | 77 | Broken | 76 in 2016 |
| Tampa | 9 | 81 | Tied | 81 in 2020 |
| West Palm Beach | 9 | 81 | Tied | 81 in 2015 |
| Key West | 9 | 87 | Broken | 84 in 2021 |
| Plant City | 10 | 80 | Broken | 79 in 2020 |
| Ochoppee | 10 | 82 | Broken | 79 in 2005 |
| Key West | 10 | 87 | Broken | 83 in 2016 |
| Lakeland | 11 | 77 | Broken | 76 in 1969 |
| Orlando | 12 | 80 | Broken | 79 in 2007 |
| Key West | 12 | 86 | Broken | 83 in 2020 |
| Clermont | 13 | 78 | Broken | 77 in 2011 |
| Miami | 13 | 82 | Tied | 82 in 2019 |
| Key West | 13 | 88 | Broken | 85 in 2020 |
| Key West | 17 | 87 | Broken | 85 in 2019 |
| Usher Tower | 18 | 78 | Broken | 76 in 1998 |
| Key West | 18 | 89 | Broken | 84 in 2021 |
| Tampa | 19 | 83 | Broken | 81 in 2018 |
| Pensacola | 19 | 82 | Broken | 79 in 2002 |
| Tampa | 20 | 83 | Broken | 81 in 1942 |
| Key West | 20 | 86 | Broken | 84 in 1962 |
| Key West | 21 | 88 | Broken | 84 in 2021 |
| Orlando | 22 | 80 | Broken | 79 in 2021 |
| Key West | 24 | 86 | Broken | 85 in 2011 |
| Stuart | 25 | 82 | Broken | 81 in 1993 |
| West Palm Beach | 25 | 83 | Broken | 82 in 2011 |
| Key West | 25 | 87 | Broken | 85 in 2011 |
| Daytona Beach | 26 | 81 | Broken | 80 in 2020 |
| Perrine | 30 | 79 | Broken | 77 in 1995 |
| Lakeland | 30 | 77 | Broken | 76 in 1970 |
| Key West | 31 | 87 | Broken | 85 in 2021 |