Prepared by Florida Climate Center
The Florida State University
Tallahassee, FL

December Key Points:
- December was much warmer, with average temperatures well above normal across the state.
- Rainfall totals for the month were below normal in most places.
- A La Niña advisory remains in effect and is expected to continue through the winter (95% chance).
- Abnormally dry conditions (D0) emerged across much of the Panhandle by the end of the month.
Average temperatures in December were well above normal across Florida. Following a colder than normal month of November, December was much warmer with average temperature departures ranging from +9.1 ̊F in Pensacola to +2.5 ̊F in Key West for the month (see Table 1 and Appendix 1 for select cities). Pensacola had its top warmest December on record, while the Gainesville, Orlando, and Tampa areas saw their second warmest Decembers on record. Several daily high maximum and high minimum temperature records were set throughout the month (see appendix 2).
Table 1. December average temperatures and departures from normal ( ̊F) for selected cities.
| Station | Mean Temperature | Departure from Normal |
| Pensacola | 64.6 | +9.1 |
| Tallahassee | 62.3 | +7.9 |
| Jacksonville | 63.4 | +6.7 |
| Orlando | 69.9 | +6.6 |
| Tampa | 71.5 | +6.6 |
| Miami | 74.5 | +3.3 |
| Key West | 75.5 | +2.5 |
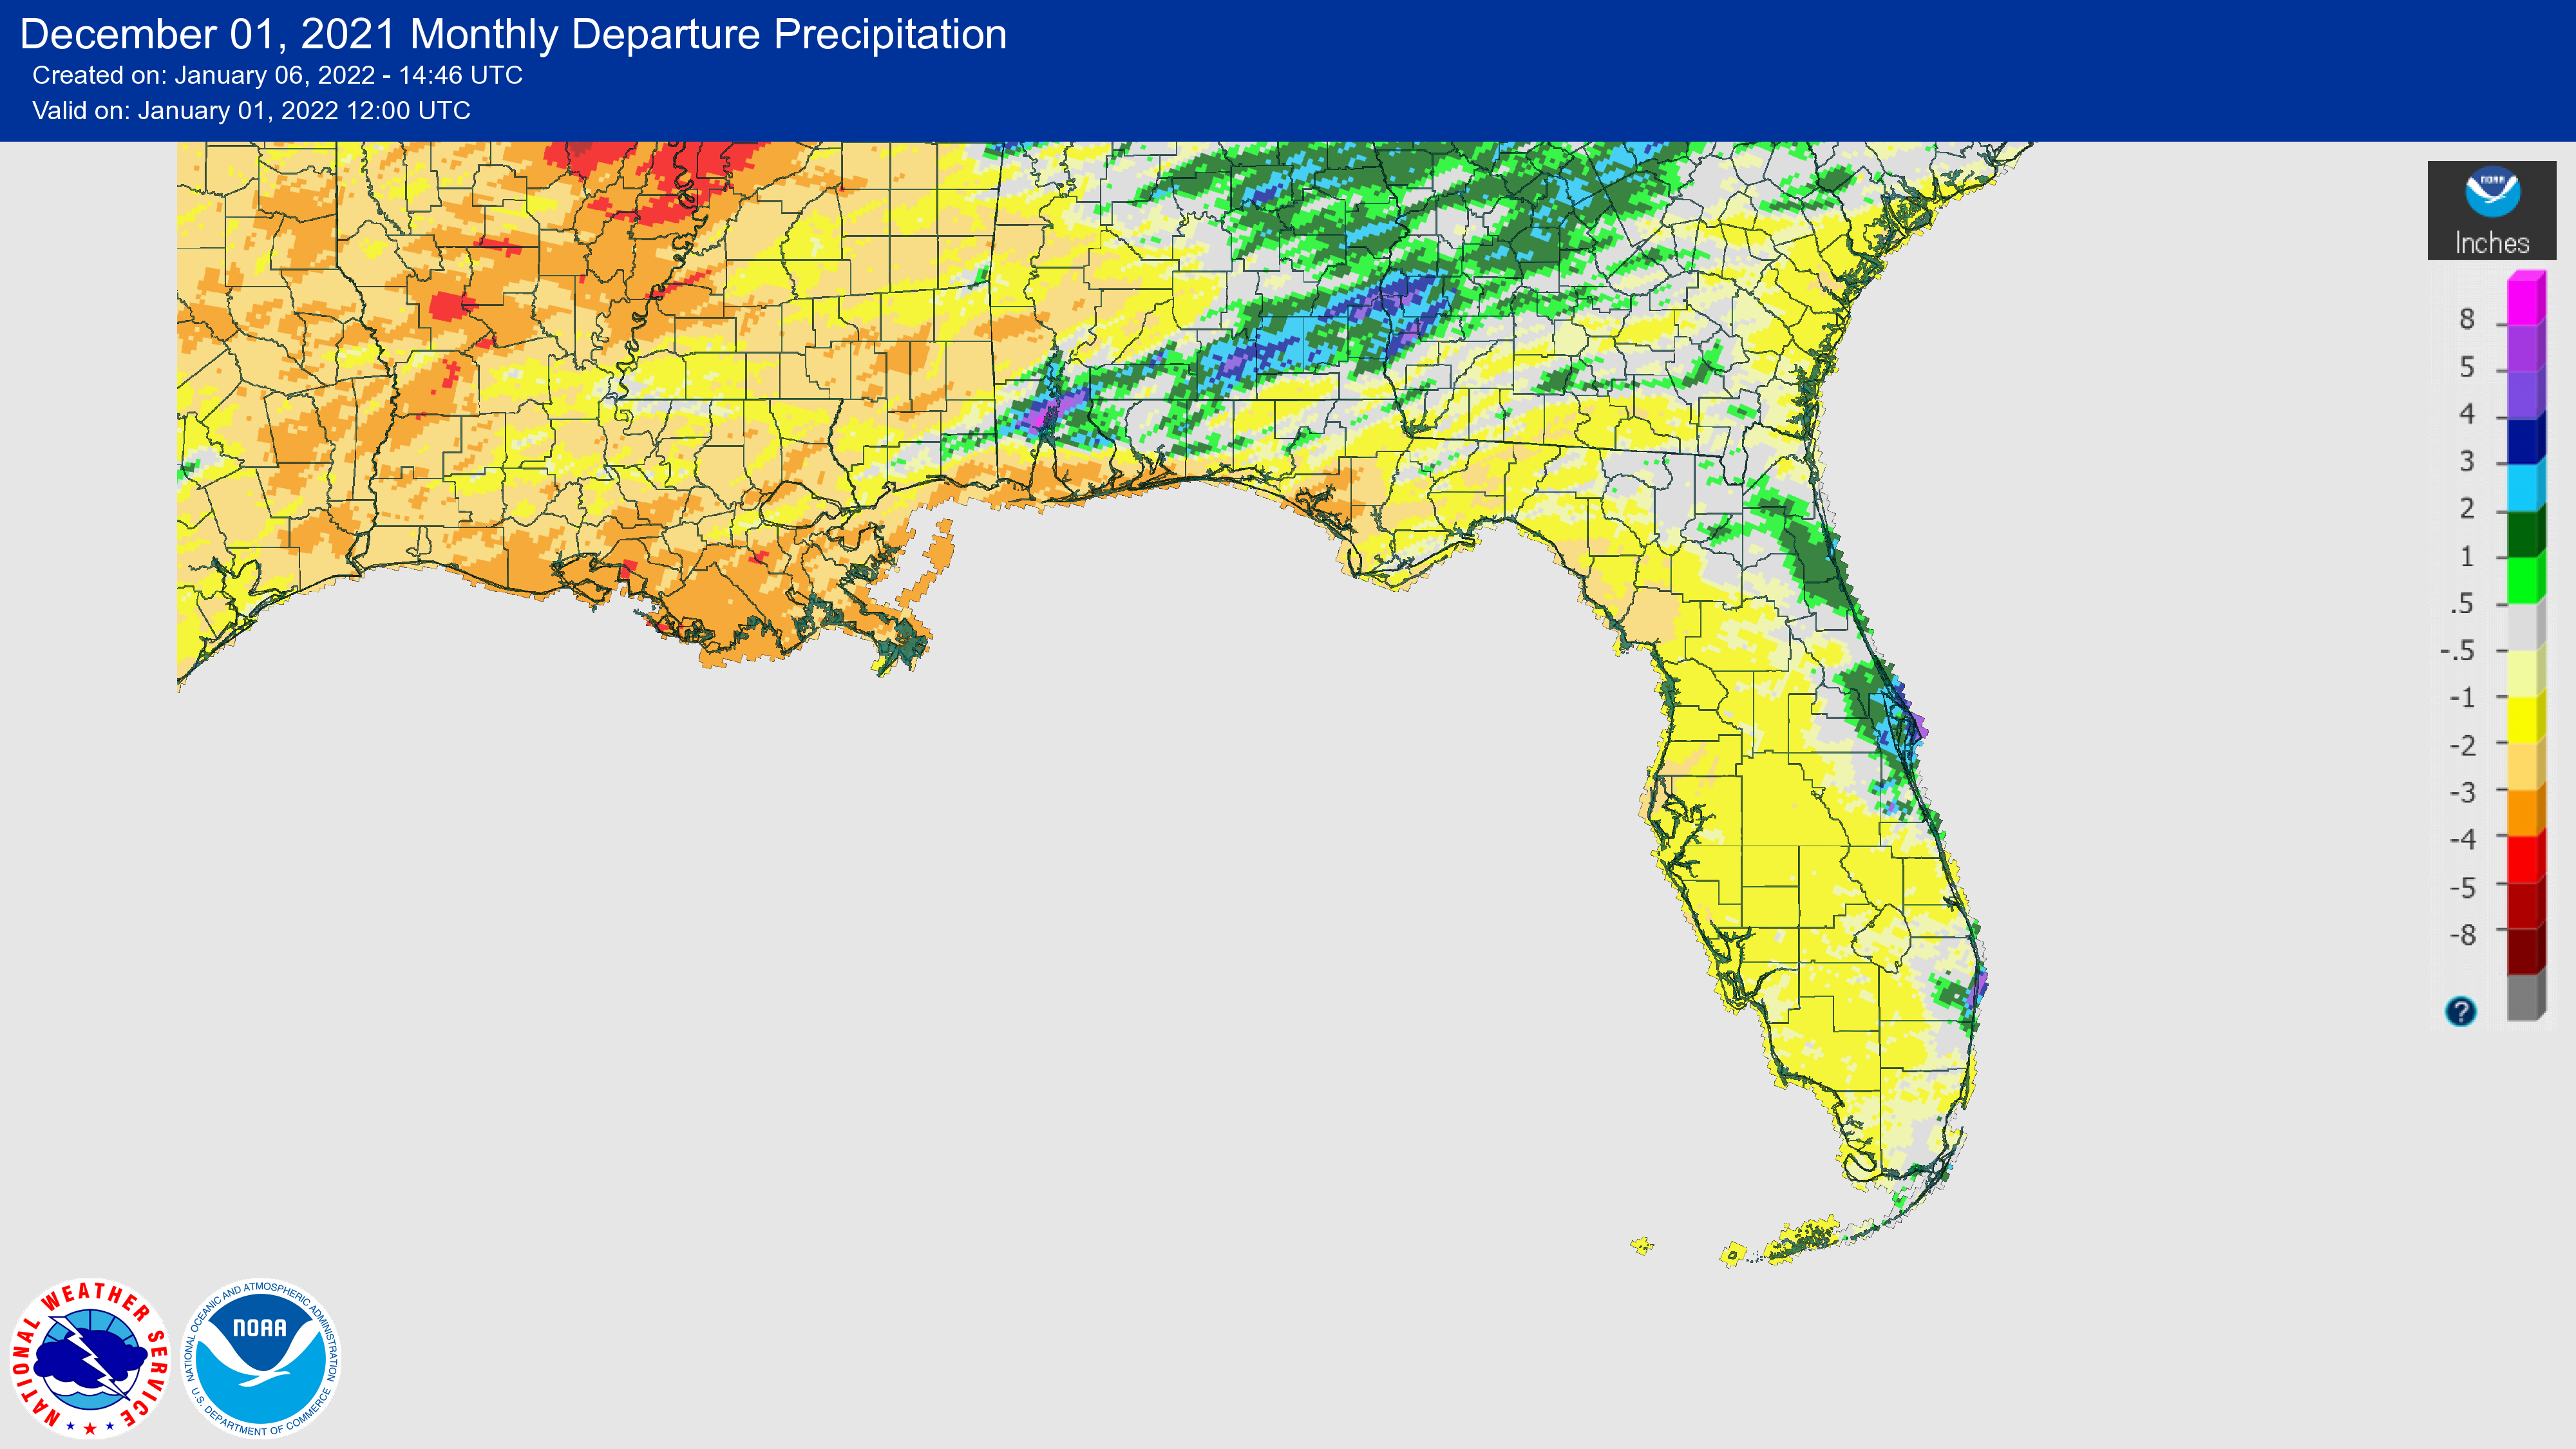
Rainfall totals in December were below normal throughout much of the state (Figure 1). Drier conditions closed out the year, with monthly departures from normal ranging from -0.40 inches in Orlando to -3.82 inches in Pensacola (Table 2 and Appendix 1). Rainfall totals in inland areas of the state, including Gainesville and Orlando, were near normal for the month.
Table 2. December precipitation totals and departures from normal (inches) for selected cities.
| Station | Total Rainfall | Departure from Normal |
| Pensacola | 1.58 | -3.82 |
| Tallahassee | 1.39 | -2.85 |
| Jacksonville | 1.61 | -1.17 |
| Orlando | 2.08 | -0.40 |
| Tampa | 0.59 | -1.97 |
| Miami | 1.19 | -1.25 |
| Key West | 1.01 | -1.15 |
Figure 1. A graphical depiction of the monthly rainfall departure from normal (inches) for December (courtesy of NOAA, NWS).
La Niña Advisory.
La Niña conditions, the cool phase of the ENSO climate pattern, continued in the tropical Pacific Ocean in December. Below-average subsurface temperatures (averaged from 180-100°W) strengthened significantly over the past month, and the sea surface temperature in the Niño-3.4 region of the tropical Pacific was about 0.9 °C cooler than the long-term (1991–2020) average. There is a 95% chance of La Niña conditions continuing through the Northern Hemisphere winter, and it is anticipated to transition to ENSO-neutral during the spring 2022 (~60% during April-June).
Hazardous Weather Events in December.
According to the Local Storm Reports issued by the local National Weather Service offices serving Florida, there were 46 individual local reports of hazardous weather events recorded across the state during the month of December (see Table 4 for a breakdown by event type). Tornadoes caused damage to homes in Starke and Freeport on the 8th, and another tornado report in Lee County on the 21st that led to one injury. On the 6th, dense fog in Quincy led to a collision that resulted in two fatalities; visibility was under one-quarter mile.
Table 4. Breakdown of storm reports submitted in Florida during the month of December (compiled from Iowa State University/Iowa Environmental Mesonet).
| Report Type | Number of Reports |
| Flash Flood | 0 |
| Flood | 0 |
| Heavy Rain | 0 |
| Dense Fog | 1 |
| Marine Thunderstorm Wind | 9 |
| Non-Thunderstorm Wind Gust | 15 |
| Non-Thunderstorm Wind Damage | 3 |
| Tornado/Waterspout/Funnel Cloud | 3/1/0 |
| Thunderstorm Wind Damage | 4 |
| Thunderstorm Wind Gust | 9 |
| Lightning | 0 |
| Wildfire | 1 |
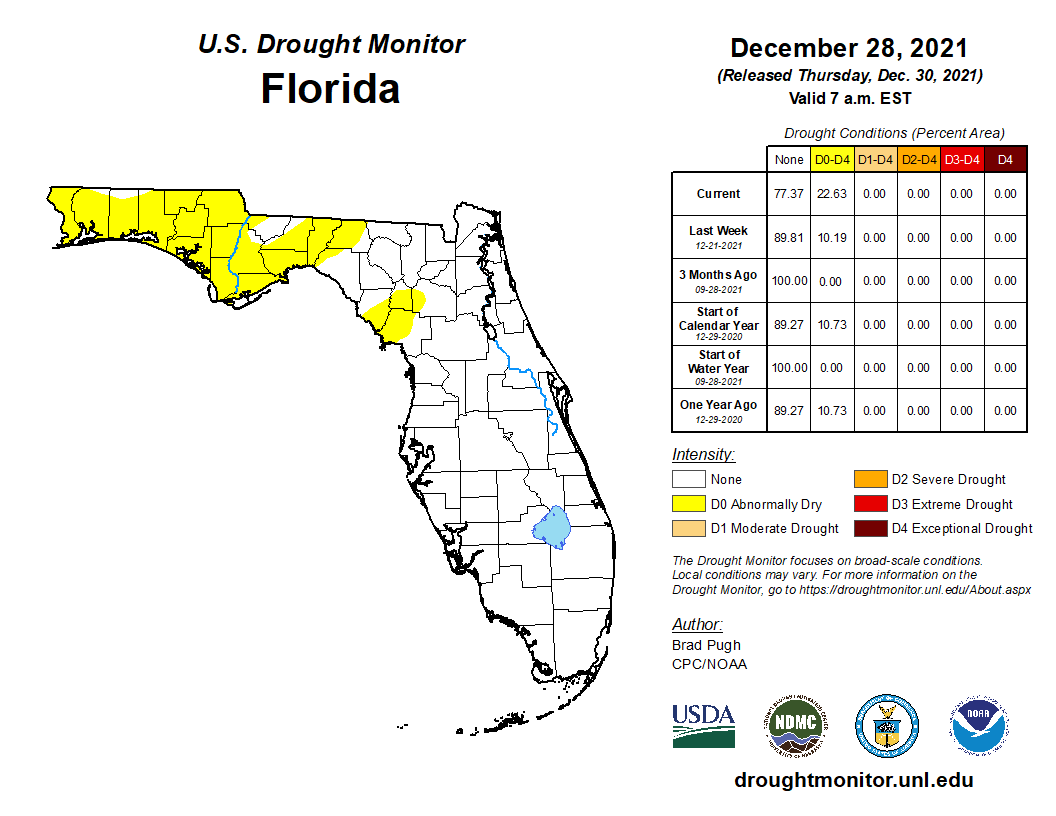
Drought-Related Impacts.
Through the month of December, abnormally dry conditions (D0) were present in parts of the Panhandle and had expanded to the entire Panhandle by end of the month. By December 28, about 22.6% of the state was experiencing abnormally dry conditions, according to the U.S. Drought Monitor.
As of December 31, the Lake Okeechobee water level was 15.52 ft. above sea level (Feet-NGVD29), which is above the average for this time of the year. The water level remained above average throughout the month. At the first of the month, the water level was around 15.8 ft. above sea level.
Agriculture-Related Impacts.
During the month of December, Florida pasture conditions remained mostly fair to good due to unseasonably warm weather. Cattle conditions also remained mostly good during the month, and sugarcane planting and harvest progressed well. Toward the end of the month, disease in the southern region of the state continued due to heavy fog. Many citrus fruits were harvested, and several vegetable crops came to market. For more information, consult the Crop Progress - State Stories reports, which are produced monthly December through March.
Appendix 1
Additional December departures from normal data for select Florida locations (Source: NWS).
| Station | Average Temperature (˚F) | Departure from Normal (˚F) | Total Rainfall (in.) | Departure from Normal (in.) |
| Gainesville | 64.5 | +7.2 | 2.88 | 0.00 |
| Sarasota | 69.3 | +4.1 | 0.92 | -1.41 |
| Melbourne | 69.0 | +2.8 | 3.39 | +1.03 |
| Fort Myers | 72.6 | +5.3 | 0.54 | -1.36 |
| West Palm Beach | 72.3 | +3.3 | 2.16 | -1.32 |
Appendix 2
Select daily record high maximum temperatures broken during December (compiled from NOAA).
| Location | Date | Record (˚F) | Broken/Tied | Last |
| Vero Beach | 8 | 87 | Broken | 85 in 1948 |
| Key West | 8 | 87 | Broken | 85 in 2007 |
| Orlando | 8 | 85 | Broken | 84 in 2013 |
| Plant City | 11 | 87 | Broken | 86 in 1894 |
| Orlando | 11 | 85 | Broken | 84 in 2013 |
| Gainesville | 11 | 84 | Broken | 83 in 2001 |
| Daytona Beach | 11 | 84 | Broken | 83 in 1961 |
| Vero Beach | 11 | 87 | Broken | 86 in 1997 |
| Key West | 11 | 87 | Broken | 85 in 2007 |
| Crestview | 11 | 81 | Broken | 79 in 2007 |
| Pensacola | 11 | 80 | Broken | 77 in 2015 |
| Tallahassee | 11 | 81 | Broken | 80 in 2007 |
| Clermont | 12 | 86 | Broken | 83 in 2001 |
| Deland | 12 | 84 | Broken | 83 in 2001 |
| Miles City | 12 | 88 | Broken | 87 in 2000 |
| Orlando | 12 | 86 | Broken | 84 in 1986 |
| Vero Beach | 12 | 88 | Broken | 86 in 1986 |
| Tampa | 13 | 86 | Broken | 85 in 2015 |
| Key West | 13 | 87 | Broken | 85 in 2009 |
| Venice | 16 | 85 | Broken | 84 in 2019 |
| Tampa | 16 | 86 | Broken | 85 in 2001 |
| Vero Beach | 16 | 85 | Broken | 84 in 2015 |
| Venice | 17 | 85 | Broken | 84 in 1956 |
| Key West | 17 | 87 | Broken | 84 in 2016 |
| Usher Tower | 18 | 83 | Broken | 82 in 1967 |
| Venice | 18 | 87 | Broken | 85 in 2016 |
| Key West | 18 | 86 | Broken | 84 in 2016 |
| Jacksonville Beach | 19 | 83 | Broken | 81 in 2017 |
| Venice | 19 | 87 | Broken | 85 in 2016 |
| Vero Beach | 19 | 90 | Broken | 85 in 1990 |
| Hialeah | 20 | 89 | Broken | 86 in 1986 |
| Clermont | 21 | 87 | Broken | 84 in 2014 |
| Pensacola | 26 | 80 | Broken | 78 in 1987 |
| Jacksonville Beach | 27 | 81 | Broken | 76 in 2015 |
| Gainesville | 29 | 82 | Broken | 81 in 2019 |
| Jacksonville Beach | 30 | 84 | Broken | 82 in 2015 |
| Crestview | 30 | 83 | Broken | 79 in 1996 |
| Pensacola | 30 | 81 | Broken | 77 in 1996 |
| Tallahassee | 30 | 82 | Broken | 80 in 2015 |
| Marianna | 31 | 83 | Broken | 80 in 1951 |
| Vero Beach | 31 | 85 | Broken | 84 in 2015 |
| Pensacola | 31 | 79 | Broken | 77 in 1996 |