Prepared by Florida Climate Center
The Florida State University
Tallahassee, FL

Average temperature departures in September were near normal across the state. Average temperature departures ranged from -1.3 ̊F in Key West to +1.7 ̊F in Orlando for the month (see Table 1 and Appendix 1 for select cities). Several daily high maximum temperature records set (see Appendix 2) and a few daily high minimum records during the month.
Table 1. September average temperatures and departures from normal ( ̊F) for selected cities.
| Station | Mean Temperature | Departure from Normal |
| Pensacola | 78.9 | -1.1 |
| Tallahassee | 78.4 | -0.7 |
| Jacksonville | 77.9 | -0.9 |
| Orlando | 82.7 | +1.7 |
| Tampa | 83.1 | +0.4 |
| Miami | 83.1 | +0.1 |
| Key West | 83.7 | -1.3 |
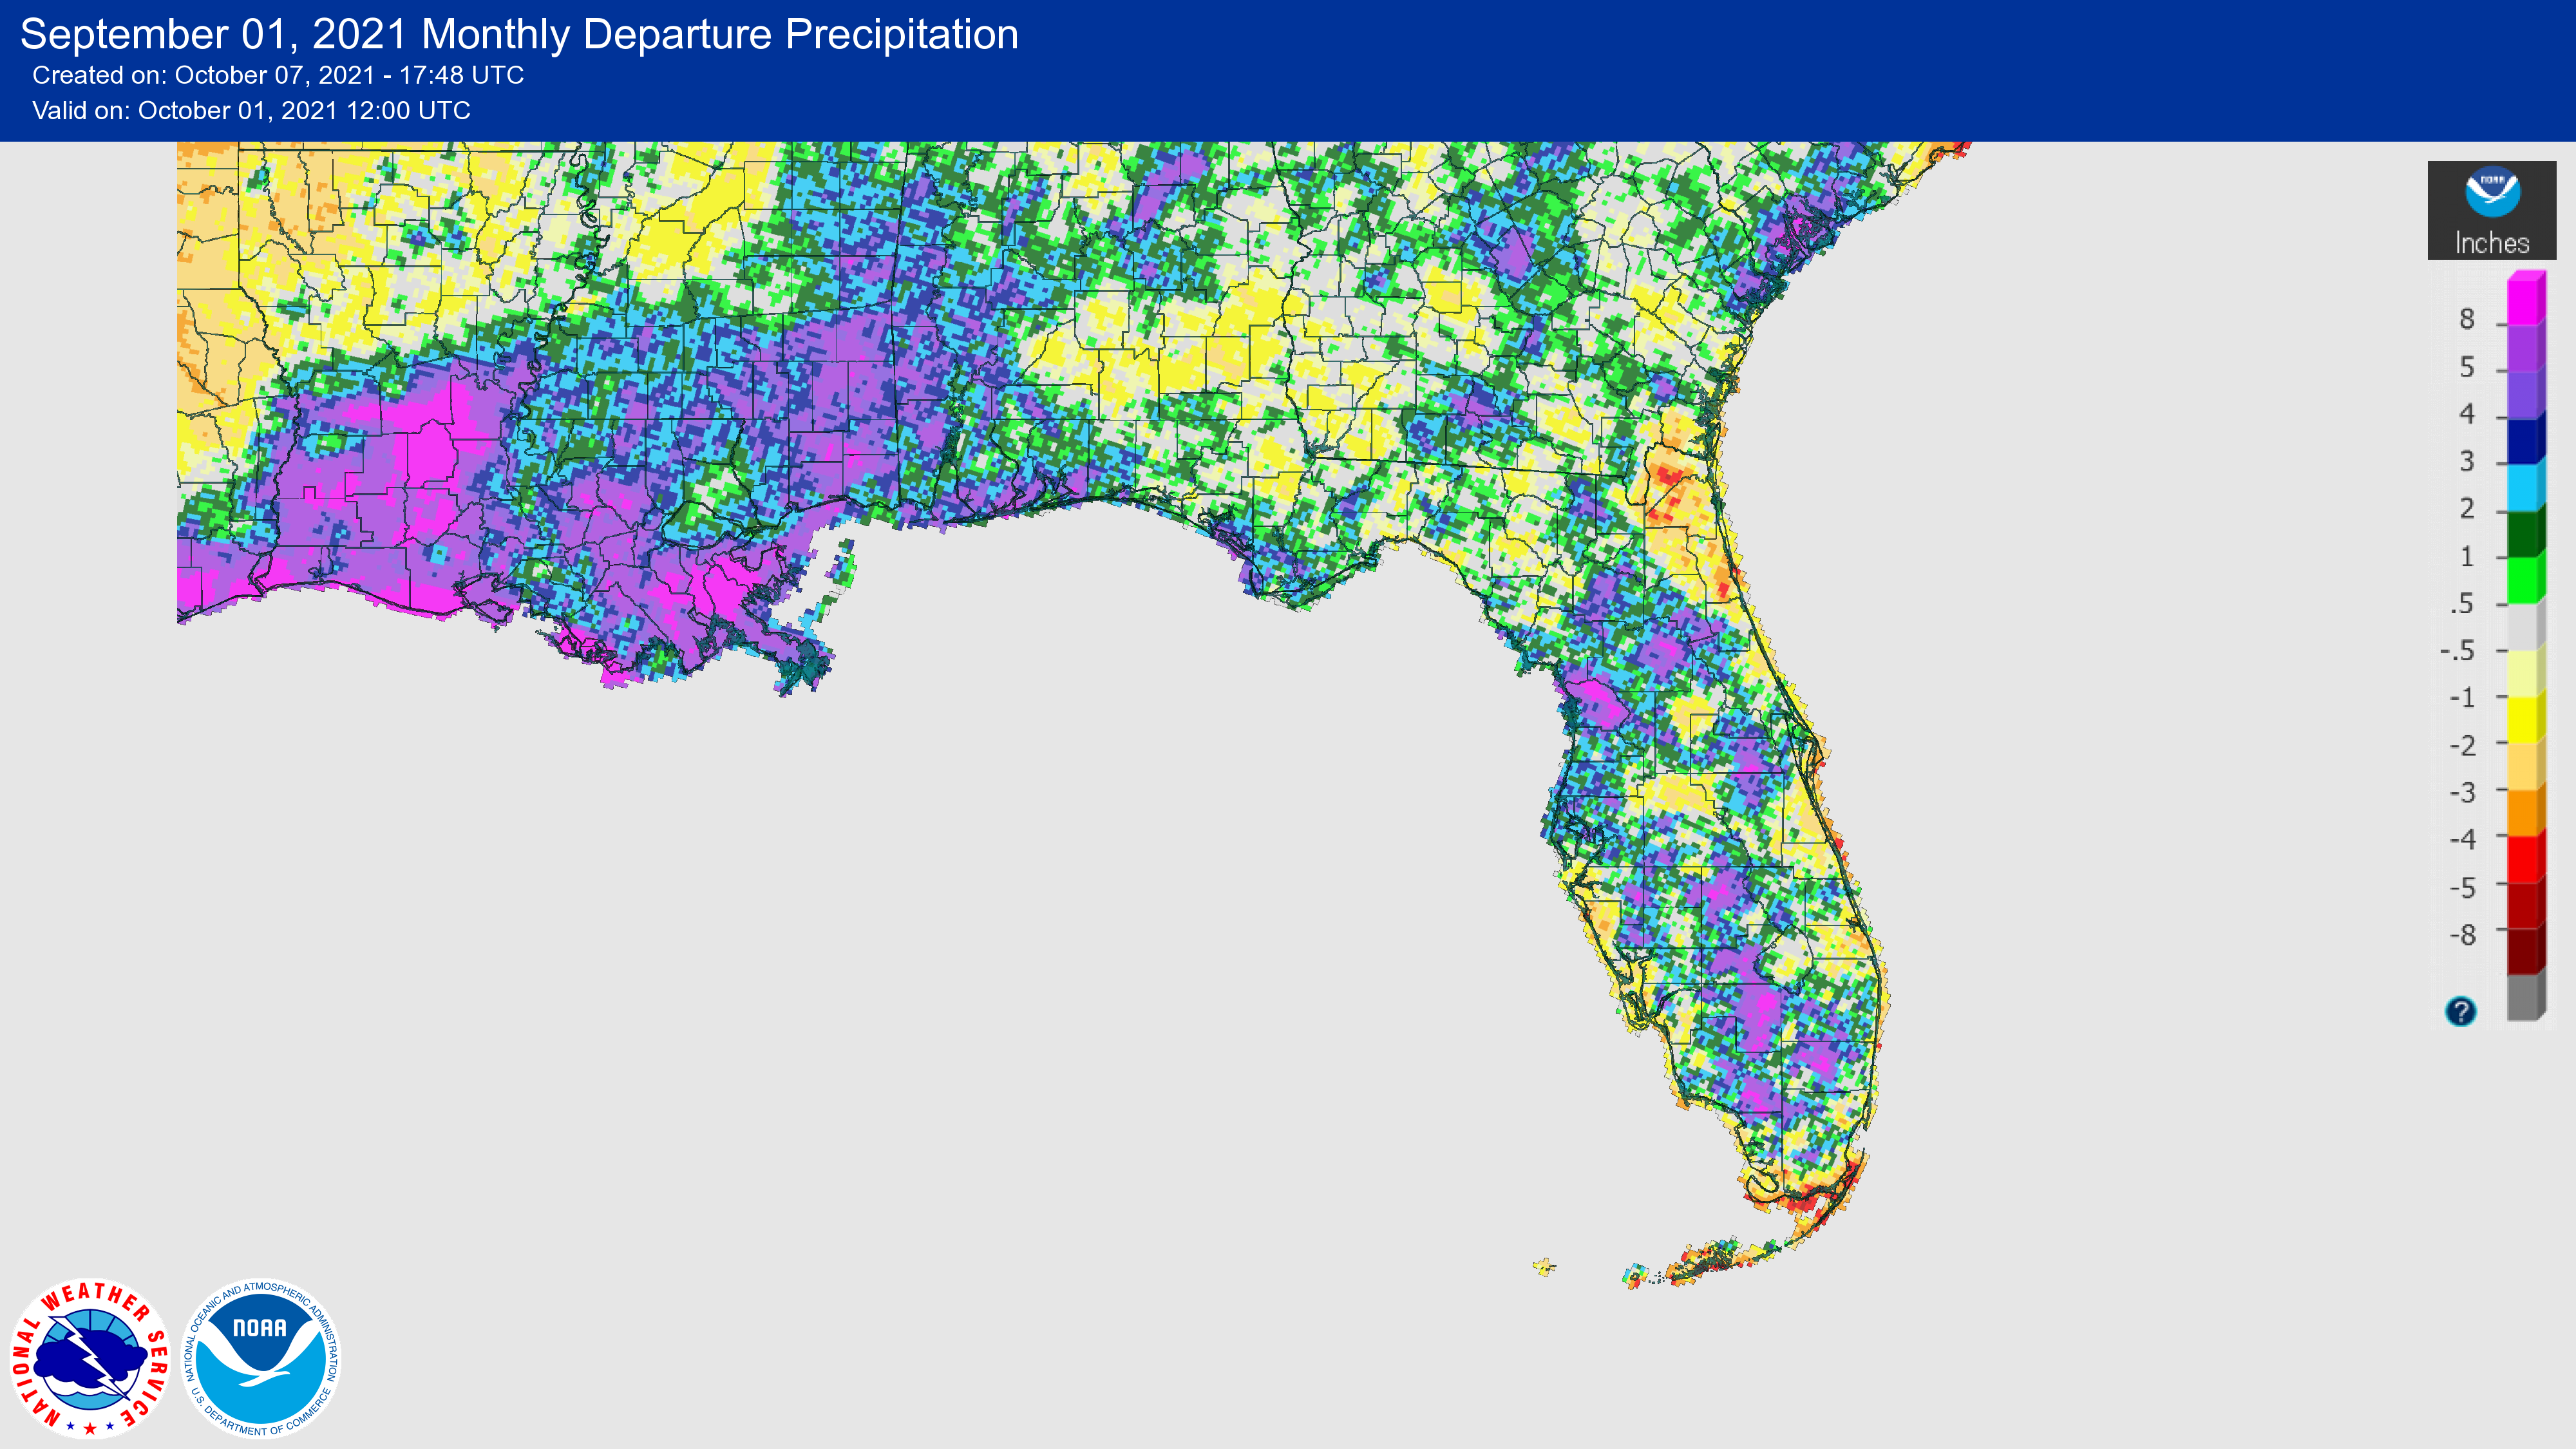
Rainfall totals in September were mixed, as many areas received well above normal rainfall while some areas had below normal rainfall (Figure 1). Monthly departures from normal ranged from +4.66 inches in Pensacola to -4.71 inches in Key West (Table 2 and Appendix 1). The western Panhandle region continues to be wetter than normal, with a surplus in annual rainfall at Pensacola nearly 20 inches above normal for the year.
Table 2. September precipitation totals and departures from normal (inches) for selected cities.
| Station | Total Rainfall | Departure from Normal |
| Pensacola | 11.27 | +4.66 |
| Tallahassee | 8.26 | +3.35 |
| Jacksonville | 5.11 | -2.45 |
| Orlando | 5.65 | -0.72 |
| Tampa | 7.39 | +1.30 |
| Miami | 12.12 | +1.90 |
| Key West | 2.53 | -4.71 |
Figure 1. A graphical depiction of the monthly rainfall departure from normal (inches) for September (courtesy of NOAA, NWS).
La Niña Watch.
The central tropical Pacific Ocean is in a neutral state, but a transition from ENSO-neutral to La Niña is favored this fall, with a 70-80% chance of La Niña emerging during the Northern Hemisphere winter 2021-22. Over the last month, ENSO-neutral conditions continued with near-to-below average sea surface temperatures persisting in the central and eastern equatorial Pacific. The latest Niño index values ranged from -0.2 °C to -0.3 °C. As of now, forecasters anticipate La Niña to be of weak strength (seasonal average Niño-3.4 index values between -0.5°C to -0.9°C).
Hazardous Weather Events in September.
According to the Local Storm Reports issued by the local National Weather Service offices serving Florida, there were 225 individual local reports of hazardous weather events recorded across the state during the month of September (see Table 4 for a breakdown by event type). Tropical Storm Mindy made landfall in the Florida Panhandle on September 9th at St. Vincent Island with maximum sustained winds of 45 mph. The system produced wind gusts of up to 61 mph and daily rainfall exceeding 4 inches in parts of Tallahassee and the surrounding area. Heavy rainfall affected several areas throughout the month, including an estimated 4.22 inches that fell in one hour at the Sanford Airport in Seminole County on the 20th. There were several reports of fatalities from rip currents during the month, as well as one fatality due to lightning in Manatee County.
Table 4. Breakdown of storm reports submitted in Florida during the month of September (compiled from Iowa State University/Iowa Environmental Mesonet).
| Report Type | Number of Reports |
| Flood | 33 |
| Flash Flood | 6 |
| Hail | 2 |
| Heavy Rain | 56 |
| Marine Hail | 1 |
| Marine Thunderstorm Wind | 26 |
| Non-Thunderstorm Wind Gust | 2 |
| Tornado/Waterspout/Funnel Cloud | 1/17/1 |
| Thunderstorm Wind Damage | 6 |
| Thunderstorm Wind Gust | 31 |
| Lightning | 2 |
| Tropical Storm | 37 |
| Rip Currents | 4 |
Drought-Related Impacts.
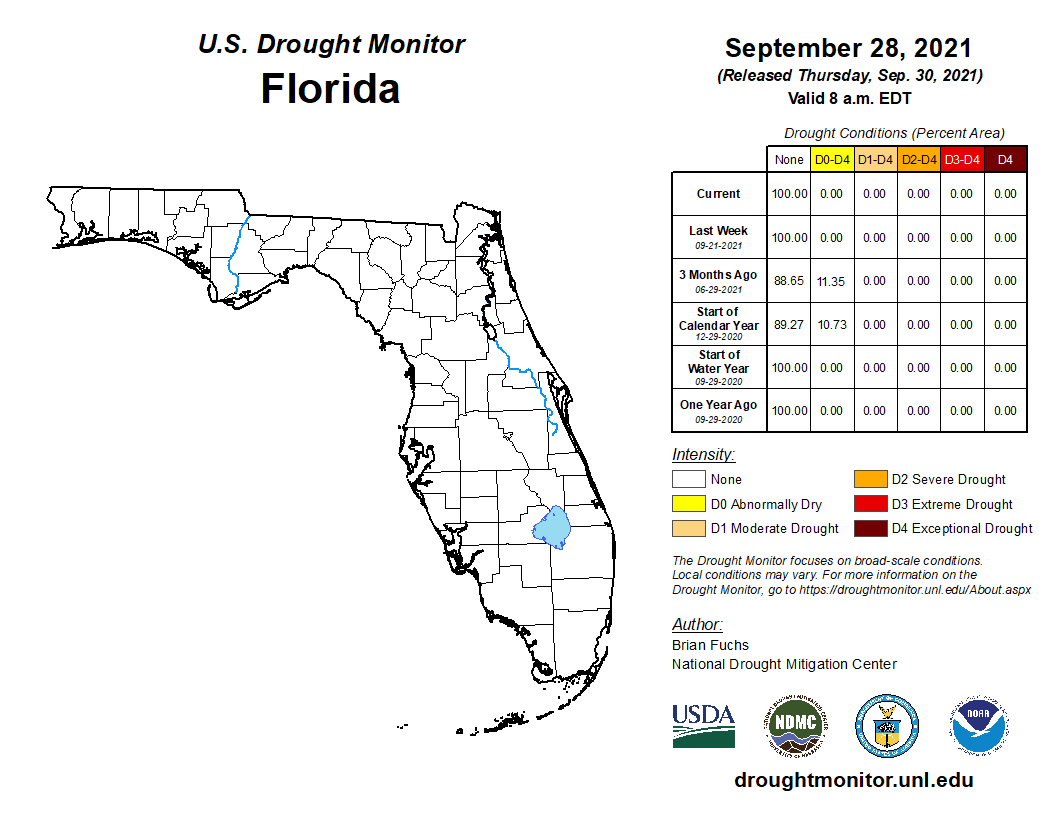
The month of September remained drought free across the state. No areas were impacted by drought, according to the U.S. Drought Monitor.
As of September 30, the Lake Okeechobee water level was at 15.55 ft. above sea level (Feet-NGVD29), which is above the average for this time of the year. The water level remained above average throughout the month. At the first of the month, the water level was 14.69 ft. above sea level.
Agriculture-Related Impacts.
During mid-September, topsoil moisture levels were adequate for 70% of the state, short in 4%, and 26% of the state was in surplus. By the end of September, topsoil moisture levels were adequate in 67% of the state, short in 5%, and 28% of the state was in surplus. Much of the state had either fair (20%), good (52%) or excellent (24%) pasture and range conditions by the end of the month. For more information, consult the weekly Crop Progress and Conditions report published by the USDA's National Agricultural Statistics Service.
Appendix 1
Additional September departures from normal data for select Florida locations (Source: NWS).
| Station | Average Temperature (˚F) | Departure from Normal (˚F) | Total Rainfall (in.) | Departure from Normal (in.) |
| Gainesville | 78.5 | -0.3 | 8.67 | +3.62 |
| Sarasota | 81.8 | -0.4 | 5.30 | -0.70 |
| Melbourne | 80.9 | -1.2 | 3.53 | -4.10 |
| Fort Myers | 83.3 | +1.1 | 9.03 | +0.03 |
| West Palm Beach | 82.4 | +0.5 | 6.64 | -1.32 |
Appendix 2
Select daily record high maximum temperatures tied or broken during September (compiled from NOAA).
| Location | Date | Record (˚F) | Broken/Tied | Last |
| Jacksonville Beach | 1 | 95 | Broken | 93 in 2007 |
| Miami | 1 | 96 | Broken | 95 in 2006 |
| Vero Beach | 1 | 95 | Broken | 94 in 2017 |
| Perrine | 2 | 95 | Broken | 94 in 1996 |
| Miami | 5 | 94 | Broken | 93 in 2020 |
| Orlando | 6 | 95 | Tied | 95 in 2019 |
| Punta Gorda | 7 | 95 | Tied | 95 in 2019 |
| Plant City | 8 | 97 | Tied | 97 in 1937 |
| Key West | 8 | 93 | Tied | 93 in 2020 |
| Vero Beach | 9 | 96 | Broken | 95 in 1987 |
| West Palm Beach | 9 | 94 | Tied | 94 in 1993 |
| Key West | 10 | 93 | Broken | 92 in 2015 |
| Punta Gorda | 12 | 96 | Tied | 96 in 2019 |
| Tampa | 12 | 95 | Broken | 94 in 2019 |
| Fort Myers | 12 | 94 | Tied | 94 in 2011 |
| Key West | 12 | 93 | Tied | 93 in 2007 |
| Tampa | 13 | 95 | Tied | 95 in 1990 |
| Plant City | 14 | 95 | Tied | 95 in 2018 |
| Key West | 24 | 91 | Tied | 91 in 2020 |
| Fort Myers | 26 | 95 | Tied | 95 in 1988 |
| Key West | 28 | 92 | Tied | 92 in 2020 |