Prepared by Lydia Stefanova, Daniel J. Brouillette, and David F. Zierden.
Florida Climate Center
The Florida State University
Tallahassee, FL

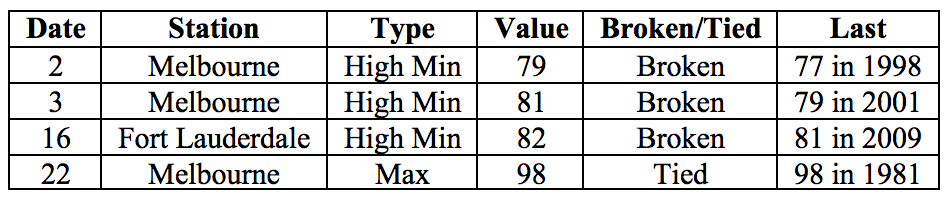
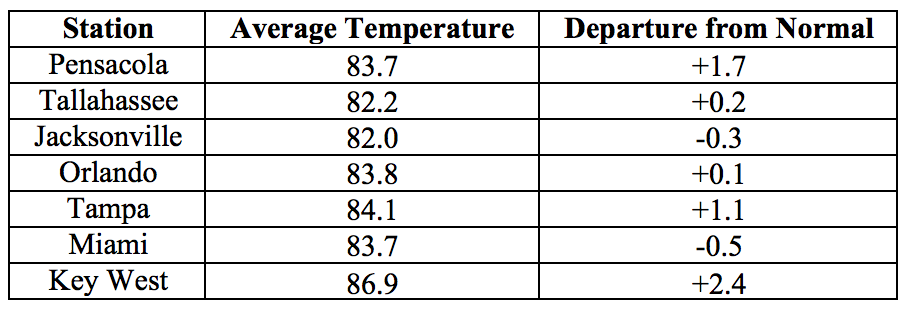
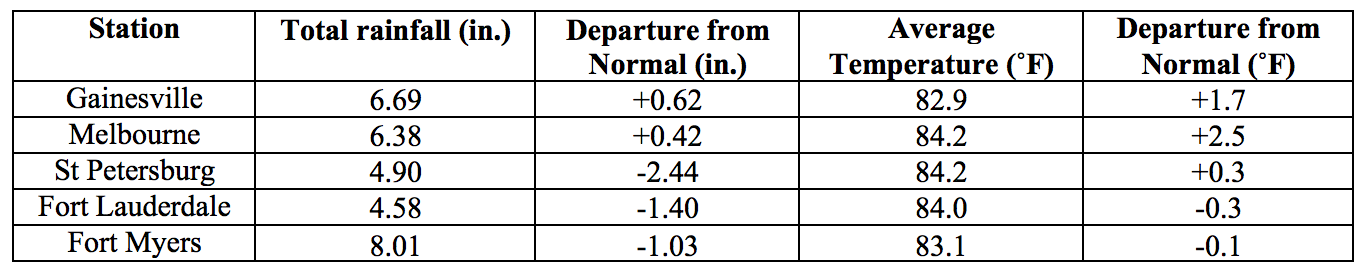
Average temperatures in July were mostly above normal. The departures from average temperatures in July 2018 were above normal across most of the state, ranging from -0.5˚F in Miami to +2.5˚F in Melbourne (Table 1 and Appendix 1). July 2018 was the warmest on record in Key West, 3rd warmest in Melbourne, and 8th warmest in Tampa and Fort Lauderdale. Several warm temperature records were tied or broken across the state (Appendix 2).
Table 1: July average temperatures and departures from normal (˚F) for selected cities.
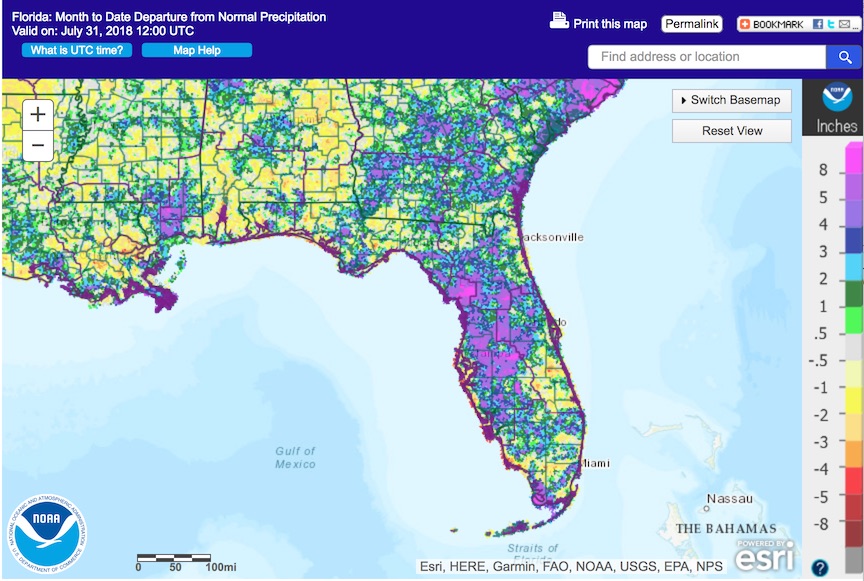
Rainfall totals in July were mixed across the state. Rainfall totals in July 2018 were mixed across the state (Figure 1). Departures from normal roughly ranged from -2.44” in St. Petersburg to +2.31 ” in Jacksonville (Table 2 and Appendix 1), though localized parts of the state saw rainfall totals that were as much as 4.00” below normal to more than 8.00” above normal (Figure 1). One 24-hour precipitation record was broken for the month (Table 3).
Table 2: July precipitation totals and departures from normal (inches) for select cities.
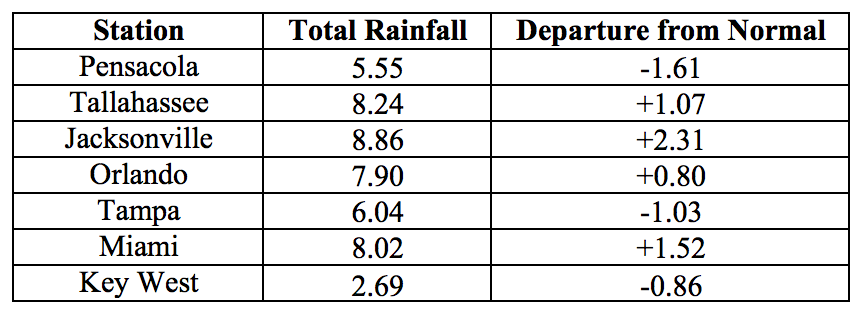
Table 3: Select daily rainfall records (inches) broken during July. (Compiled from NOAA, NWS).
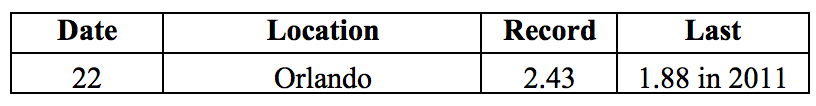
Figure 1: A graphical depiction of the monthly rainfall departure from normal (inches) for July is given in the figure below (courtesy of NOAA, NWS)
ENSO-Neutral Conditions are Present in the Pacific.
Based on current data and forecast models, the Climate Prediction Center (CPC) has set the ENSO Alert System Status to El Niño Watch. ENSO-neutral conditions are currently present, with sea surface temperatures (SST) near- to above-average across most of the Pacific Ocean. ENSO-neutral conditions are favored through the summer, with an increasing probability of El Niño developing into Fall and Winter 2018. The CPC seasonal outlook favors above-normal temperatures for Florida through September 2018.
Hazardous Weather Events in July.
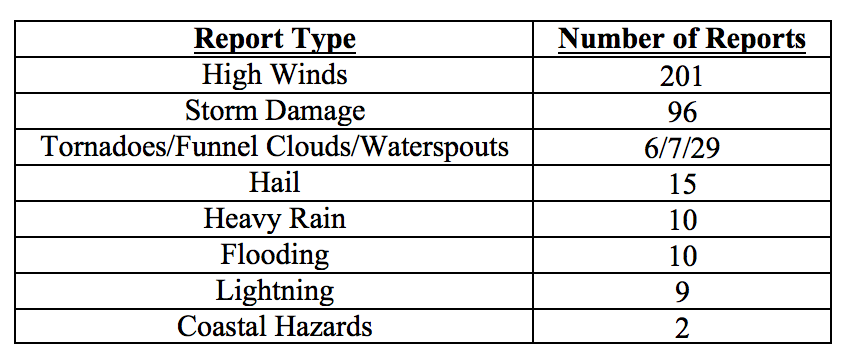
A total of 385 hazardous weather events were logged in the National Weather Service’s Local Storm Reports database for the state during the month of July (see Table 4 for a breakdown by type). The most frequent types of hazardous weather conditions encountered throughout the month involved high winds and storm damage. Over half (199) of all hazardous weather occurred between the 21st and 23rd of the month when the circulation was impacted by a low-pressure system over the area.
Two hazardous weather-related fatalities and several injuries were reported as a result of thunderstorms, lightning, and rip currents. Strong thunderstorm winds downing a large tree in Daytona Beach caused one injury and one fatality on the 22nd of the month. Two people were injured by a lightning strike on the 10th of the month in Palm Beach. One fatality was the result of a rip current at the coast near Melbourne. According to broadcast media, over 140 people were rescued from rip currents along the coast of Volusia County between the 10th and 11th of the month.
Thunderstorm wind gusts exceeding 50 mph were measured on various instances in Alachua, Bay, Brevard, Collier, Duval, Franklin, Manatee, Miami-Dade, Palm Beach, Pinellas, and Volusia Counties. Gusts over 60 mph were reported on the 23rd over St. George Island in Franklin County and near Dunedin in Pinellas County.
Three weak and brief tornadoes were seen in South Florida (in Dade, Broward, and Palm Beach Counties), and three more were reported in St. Johns, Flagler, and Lake Counties. There were 21 waterspouts observed along the Atlantic Coast, with 18 of those reported in the area from Miami to the Florida Keys. Eight waterspouts were observed in the Gulf coastal waters between Clearwater and Pensacola.
Table 4: Breakdown of storm reports submitted in Florida during the month of July (Compiled from Iowa State University/Iowa Environmental Mesonet.)
Drought-Related Impacts.
As of the latest US Drought Monitor Report issued on July 24th the entire state has remained free since the end of May, despite the below-normal rainfall in parts of the state during the last month.
At the end of the month, Lake Okeechobee water levels were at 14.36 ft., which is somewhat higher than normal for this time of the year. Algal bloom in the lake remains a serious concern, as it is now covering some 40% of the lake surface. Water releases from the lake are being made to ensure available lake capacity since the tropical season has the potential to fill the lake in a very short period
Agriculture-Related Impacts.
At the beginning of July, topsoil moisture levels were at mainly adequate (82%) or surplus (16%). By the end of the month topsoils were somewhat wetter, with 72% adequate and 24% surplus values.
During most of the month the citrus growing region has been experiencing normal to above-normal temperatures, with frequent and widespread rainshowers. Canals and ditches generally had ample water for irrigation, and irrigation was run as needed in areas that received less rain. The citrus fruit are developing well and growers have a positive outlook for the upcoming crop. Pasture quality has been mostly good, although oversaturated pastures and standing water have been observed in some low-lying fields in areas that received large amounts of rain, particularly in the northern part of the state. Cattle are in mostly good condition. Hay cutting was going on throughout the month in Dixie, Jackson, Levy, and Lafayette Counties, with delays in areas with wet conditions. Row crop planting in the Panhandle has been delayed because of oversaturated fields, and peanut plantings in Levy County are suffering from excess water. Corn was being harvested in Dixie, Levy, Okeechobee, and Palm Beach Counties. Sugarcane is doing well.
Appendix 1: Additional July departures from normal data for Florida locations.
Appendix 2: Select daily maximum and minimum temperature records (° F) broken or tied during July (compiled from NOAA, NWS).