Prepared by Lydia Stefanova, Daniel J. Brouillette, and David F. Zierden.
Florida Climate Center
The Florida State University
Tallahassee, FL

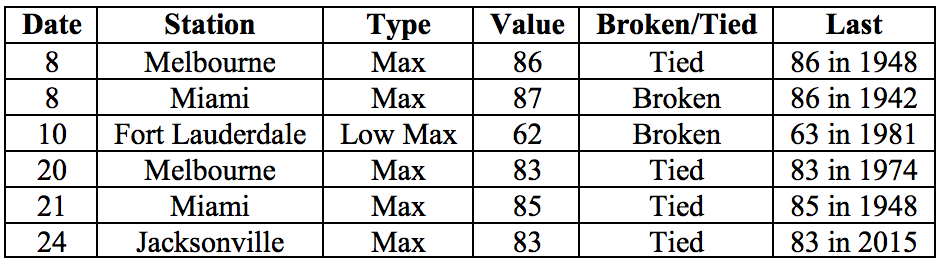
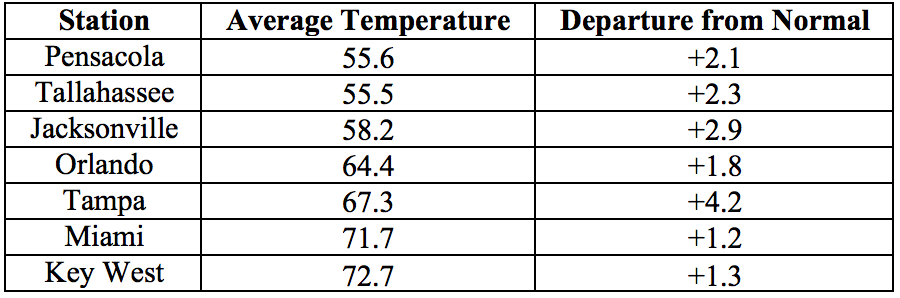
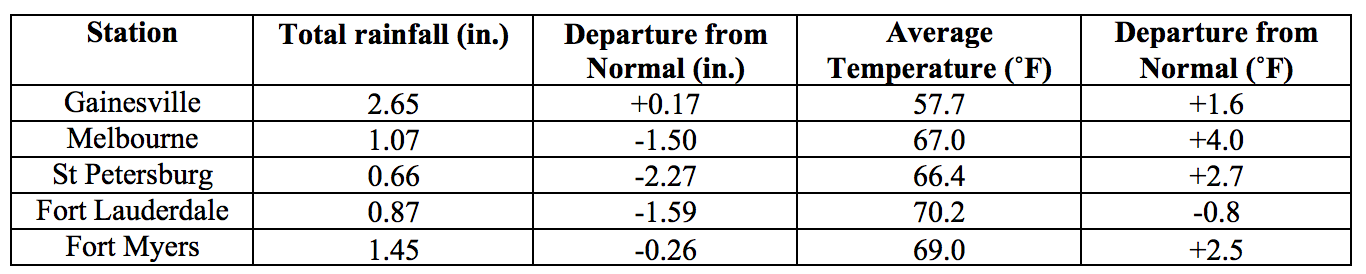
Average temperatures in December were generally above normal across the state. The departures from average temperatures in December 2017 were above normal across the entire state, ranging from -0.8˚F in Fort Lauderdale to +4.2˚F in Tampa (Table 1 and Appendix 1). Below-freezing temperatures were reported on one or more nights at most stations in the panhandle as well as some interior locations in the northern part of the peninsula. A handful of daily temperature records were tied or broken across the state (Appendix 2). Amongst stations with records going back over 100 years, 2017 was the warmest year on record in Pensacola (138 years in record), Tampa (127 years in record), and Ocala (111 years in record). It was the 2nd warmest for Miami (117 years in record), 3rd warmest year on record for Key West (143 years in record), Fort Myers (114 years in record), 5th for West Palm Beach (117 years in record), 6th warmest for Jacksonville (146 years in record), and 7th for Tallahassee (115 years in record).
Table 1: December average temperatures and departures from normal (˚F) for selected cities.
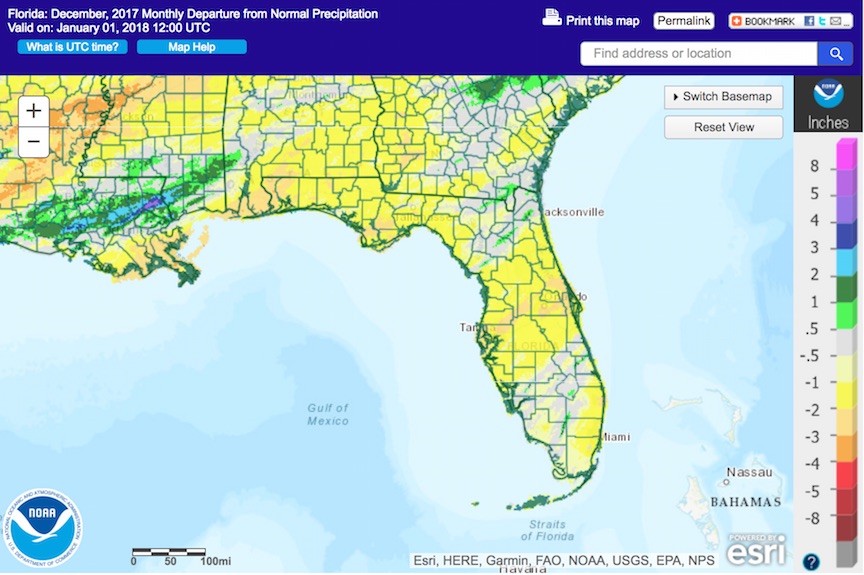
Rainfall totals in December were generally below normal across the state. Rainfall totals in December 2017 were below everywhere in most of the state (Figure 1). Departures from normal roughly ranged from -2.27” in St. Petersburg to +0.17” in Gainesville (Table 2 and Appendix 1), though localized parts of the state saw rainfall totals that were as much as 3.00” below normal to 2.00” above normal (Figure 1). One 24-hour precipitation record was broken for the month (Table 3). Amongst stations with records going back over 100 years, 2017 was the 2nd wettest year on record for Pensacola, and 5th wettest for Jacksonville and Miami.
Table 2: December precipitation totals and departures from normal (inches) for select cities.
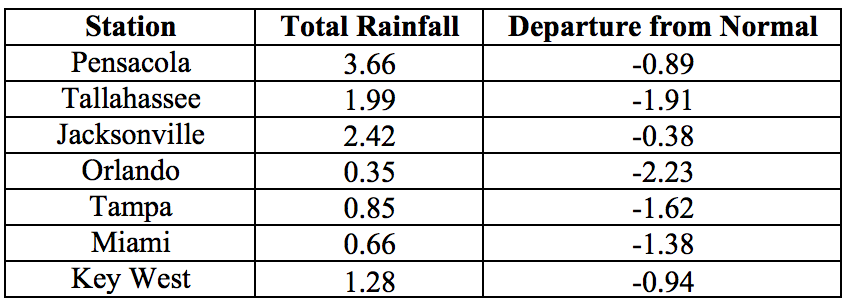
Table 3: Select daily rainfall records (inches) broken during December. (Compiled from NOAA, NWS).
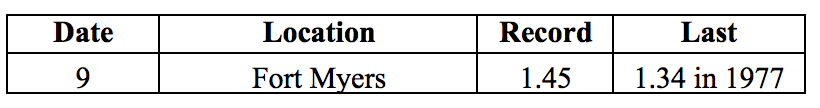
Figure 1: A graphical depiction of the monthly rainfall departure from normal (inches) for December is given in the figure below (courtesy of NOAA, NWS)
La Niña Conditions are Present in the Pacific.
Based on current data and forecast models, the Climate Prediction Center (CPC) the ENSO alert system status is set to La Niña Advisory. La Niña conditions are currently present, with below normal sea surface temperatures across the central and eastern equatorial Pacific Ocean. Forecast models predict that La Niña conditions will continue through the winter, with a transition to ENSO-neutral likely during mid- to late spring 2018. Taking into account the ENSO forecast and long-term trends, the CPC seasonal outlook favors above-normal temperatures and below-normal precipitation for Florida through March 2018.
Hazardous Weather Events in December.
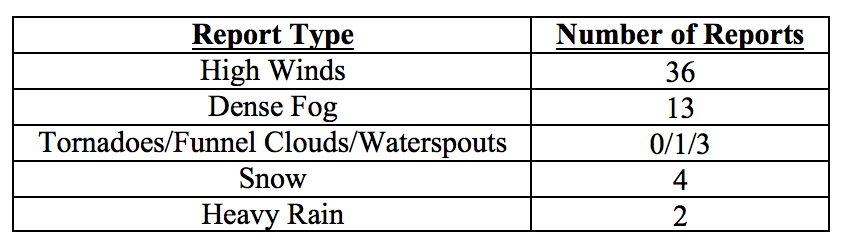
December 2017 was a relatively quiet month for Florida, with 59 hazardous weather events recorded throughout the state. Over two-thirds of the hazardous weather reports for December were made on the 9th of the month and associated with a cold front passage. On that date, strong winds were reported across the central and south portions of the state, with gusts up to 58mph seen in Collier County; a few instances of light snow were reported in the panhandle, and ice over a bridge in Escambia County led to a fatal crash. Multiple instances of hazardous driving conditions due to dense fog were reported on the 22nd and 29th of the month in the southern portion of the state, with reduced visibility ranging from less than one quarter mile to just a few feet.
Table 4: Breakdown of storm reports submitted in Florida during the month of December (Compiled from Iowa State University/Iowa Environmental Mesonet.)
Drought-Related Impacts.
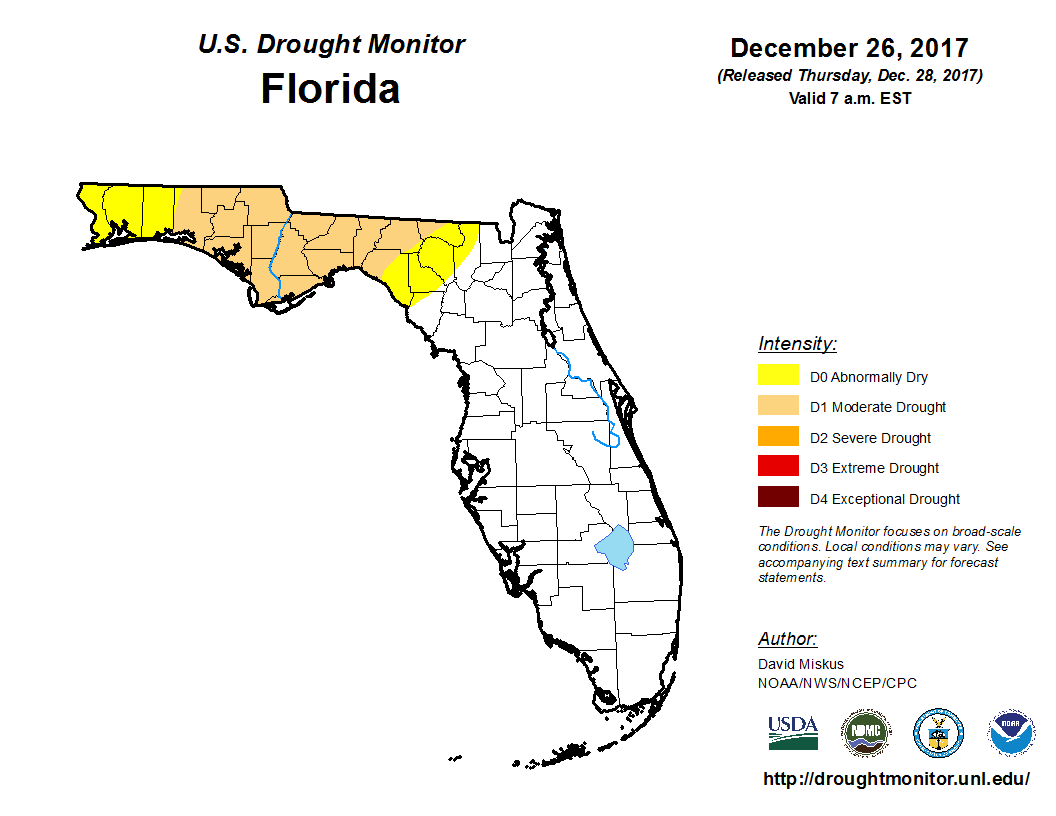
At the end of November, about 22% of the state was experiencing abnormally dry (D0) conditions, and about 12% of the state (including Bay, Calhoun, Gadsden, Gulf, Holmes, Jackson, Franklin, Liberty, Washington, and parts of Leon, Walton, Wakulla Counties) was under moderate drought (D1). As the month progressed, D0 conditions were lifted from Alachua, Baker, Bradford, Citrus, Gilchrist, Levy, Marion, Union, and most of Dixie County. At the same time, the area covered by D1 conditions expanded further westward, into Jefferson, Madison, northwest Taylor and northwest Hamilton counties. Overall, about 9.5% of the state is under D0, and about 18% - under D1 conditions. As of the latest U.S. Drought monitor report, released on December 26th, approximately 765, 000 Florida citizens are currently in drought-impacted areas.
The water levels in Lake Okeechobee have been gradually returning down closer to normal values for this time of the year, and measured at 15.49 feet at the end of December.
Figure 2: Latest U. S. Drought Monitor Map for Florida (from http://droughtmonitor.unl.edu/)
Agriculture-Related Impacts.
At the beginning of December, topsoil moisture levels across the state were mainly adequate (50%) to short (29%), with some surplus and few very short values. This distribution remained in effect for the duration of the month, with only minor changes. The citrus region remained drought-free throughout the month, but most groves were running irrigation to compensate for only sporadic rainfall. Some growers reported early blooming, possibly affected by warmer temperatures. Some vegetables in Palm Beach County also required irrigation due to insufficient rainfall, and some vegetable crops in southern counties saw increase in disease resulting from foggy conditions. Pasture quality is seasonally declining, and was affected by generally low amounts of rainfall. Some pastures were reported damaged by frost in Dixie, Jackson, Osceola and Walton Counties. Cattle are provided supplemental feeding as necessary and remain in mostly good conditions.
Appendix 1: Additional December departures from normal data for Florida locations.
Appendix 2: Select daily maximum and minimum temperature records (° F) broken or tied during December (compiled from NOAA, NWS).