Prepared by Florida Climate Center
The Florida State University
Tallahassee, FL

April Key Points:
- Temperatures were above normal across the Florida Peninsula and near or below normal across much of the northern part of the state.
- Rainfall was above normal across the state, except in parts of southern Florida.
- La Niña Advisory continued but weakened with an 80% chance for a transition to ENSO-neutral conditions during the next month or so.
- Strong storms swept through the South on April 9-10, with heavy rain, quarter to nearly golf ball-sized hail, and multiple reports of tornadoes.
- Abnormally dry conditions persisted across the southern Peninsula, with moderate drought across Monroe and parts of Collier counties.
Average temperatures in April were near or below normal across much of the Panhandle and northern parts of the state and above normal across southern Florida. Average temperature departures ranged from -1.3 ̊F in Jacksonville to +2.4 ̊F in Key West for the month (see Table 1 and Appendix 1 for select cities). There were several daily high maximum and high minimum temperature records set during the month, mostly across the Florida Peninsula (see Appendices 2 and 3).
Table 1. April average temperatures and departures from normal ( ̊F) for selected cities.
| Station | Mean Temperature | Departure from Normal |
| Pensacola | 67.0 | +0.4 |
| Tallahassee | 65.5 | -0.8 |
| Jacksonville | 65.7 | -1.3 |
| Orlando | 71.8 | +0.6 |
| Tampa | 73.9 | +1.9 |
| Miami | 77.4 | +1.6 |
| Key West | 78.8 | +2.4 |
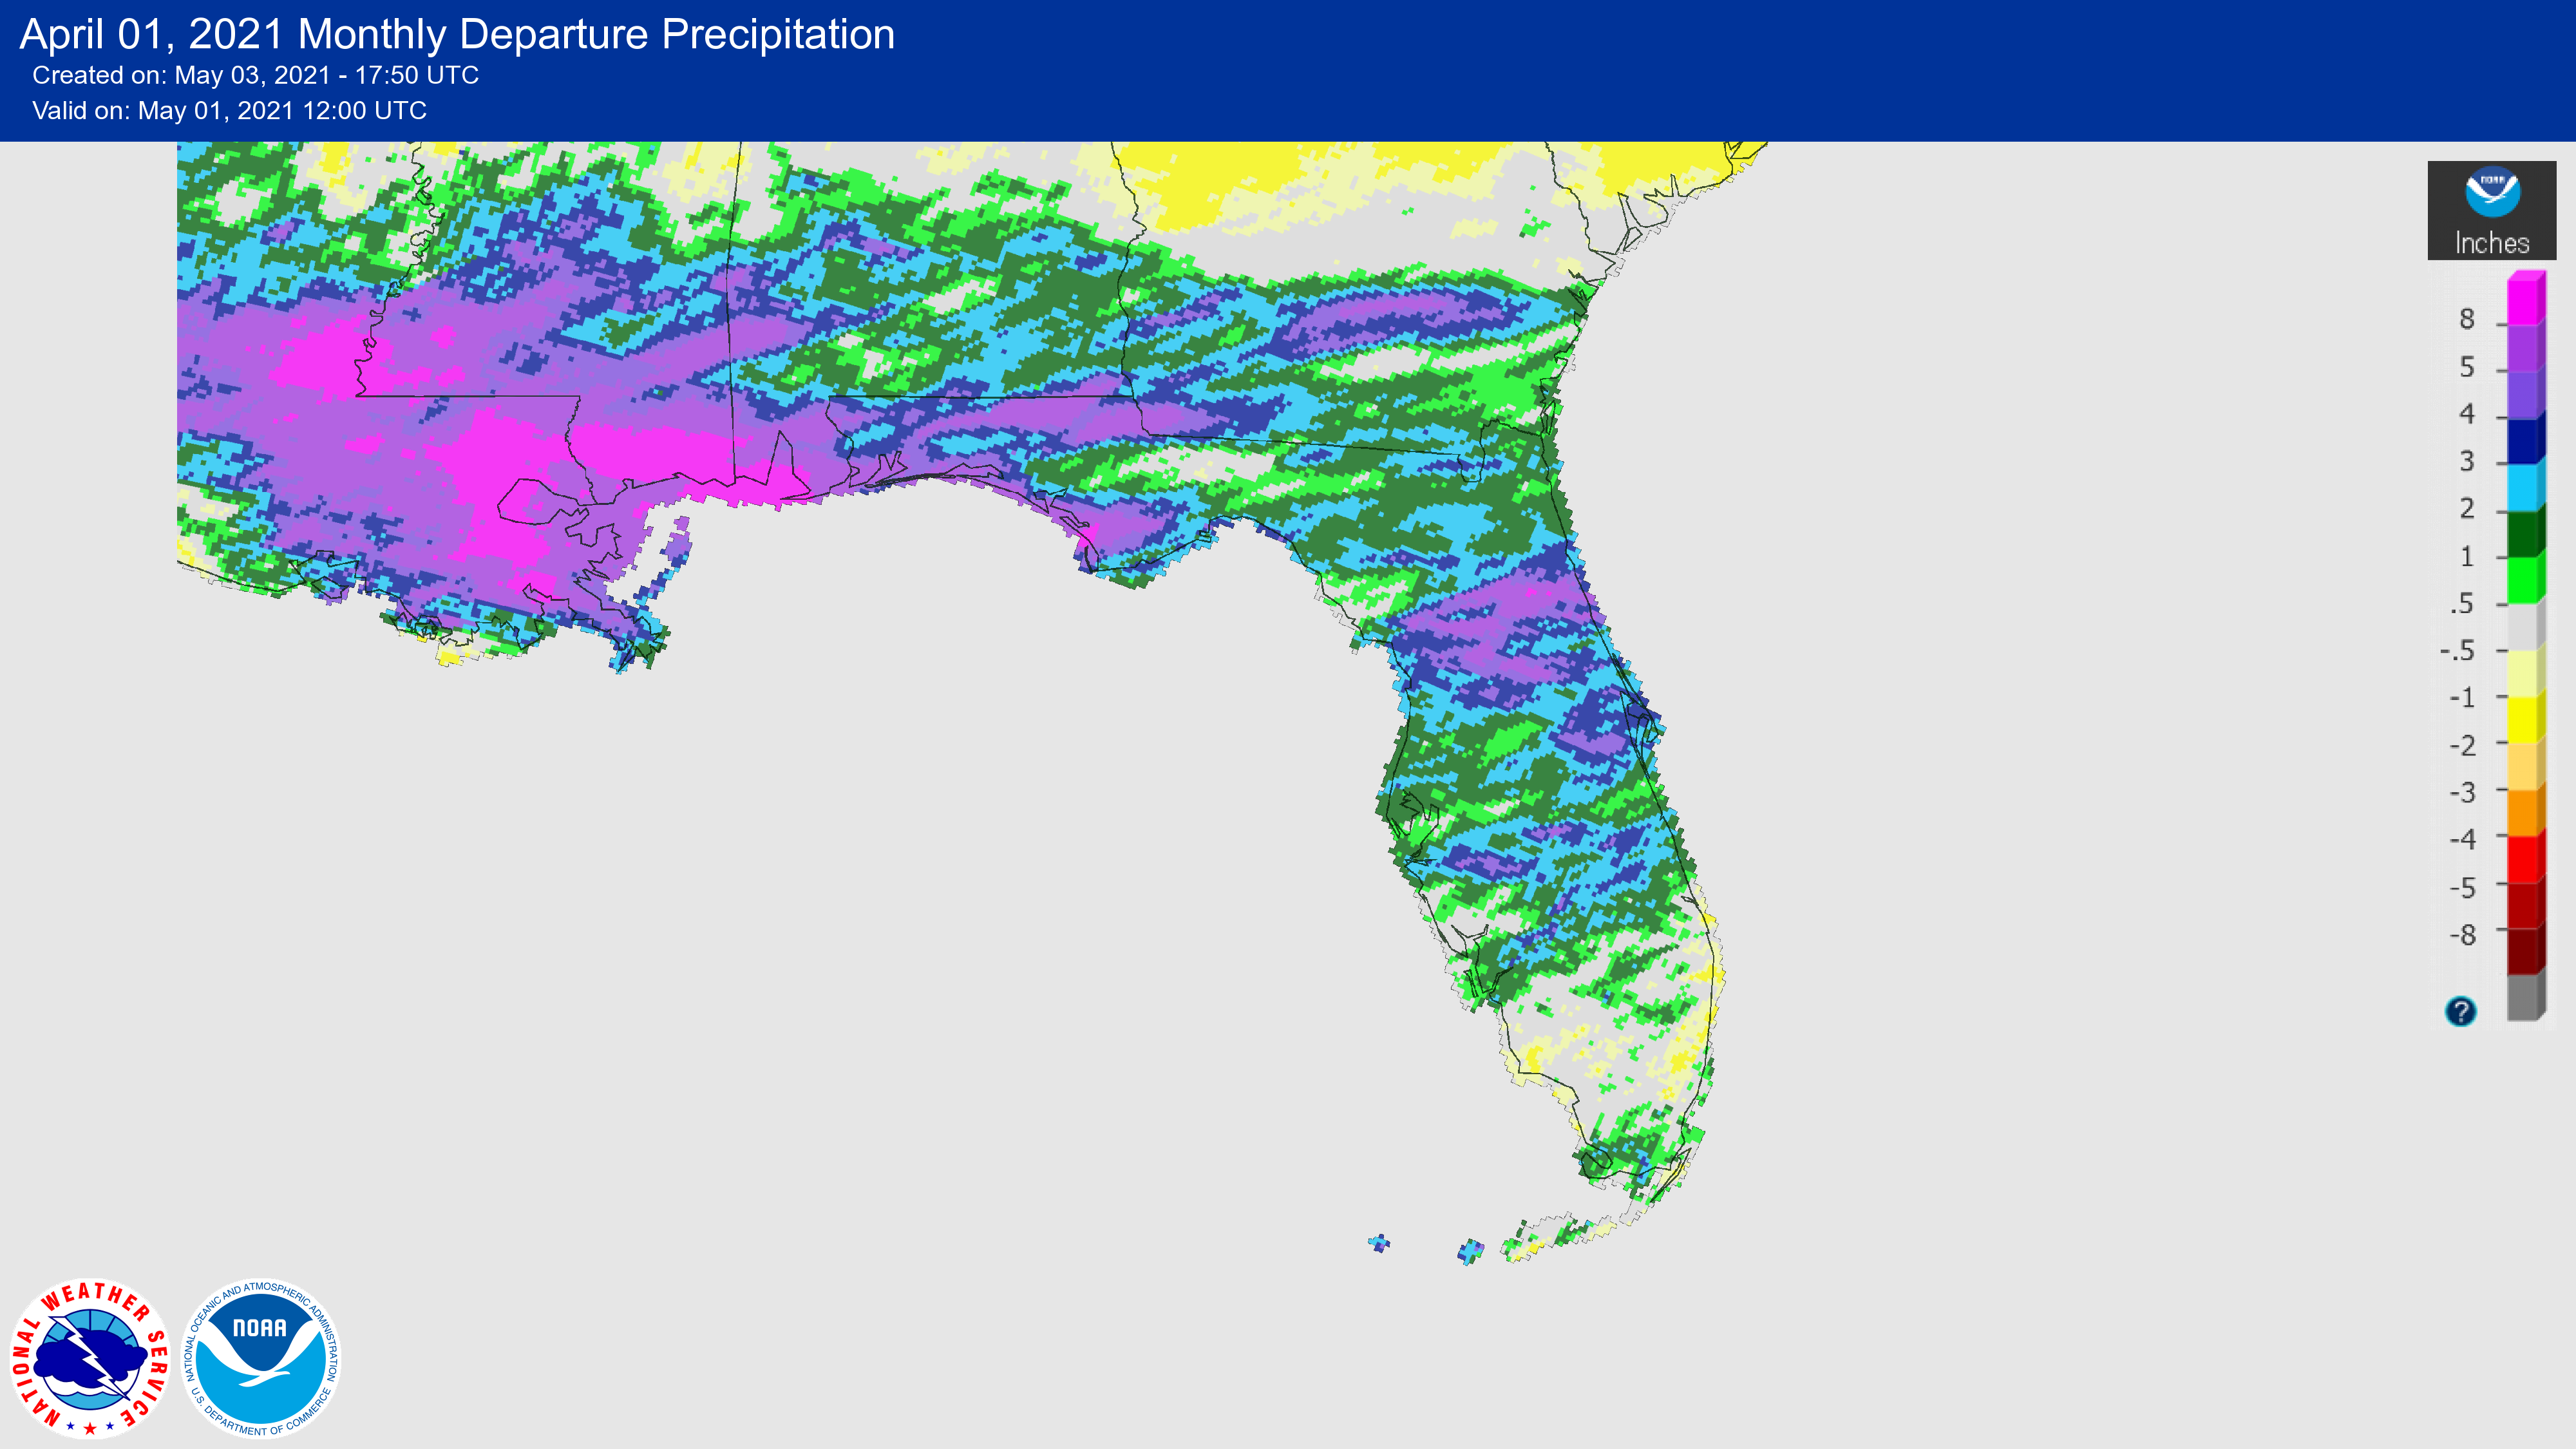
Rainfall totals in April were above normal across most of the state but below normal in parts of south Florida (Figure 1). Monthly departures from normal ranged from -0.94 inches in Key West to +5.97 inches in Pensacola (Table 2 and Appendix 1). Hastings observed its third wettest April on record; Orlando had its fourth wettest April; and Pensacola had its fifth wettest April on record. Many daily precipitation records were also set. Pensacola recorded the highest daily rainfall amount during the month, which occurred on the 10th with 4.03 inches, beating its previous record of 2.61 inches on that day in 1959.
Table 2. April precipitation totals and departures from normal (inches) for selected cities.
| Station | Total Rainfall | Departure from Normal |
| Pensacola | 10.29 | +5.97 |
| Tallahassee | 3.51 | +0.45 |
| Jacksonville | 5.49 | +2.85 |
| Orlando | 6.34 | +3.66 |
| Tampa | 3.35 | +1.32 |
| Miami | 2.81 | -0.33 |
| Key West | 1.11 | -0.94 |
Figure 1. A graphical depiction of the monthly rainfall departure from normal (inches) for April (courtesy of NOAA, NWS).
La Niña Advisory; Shifting to ENSO-Neutral.
La Niña conditions continued during April with below average sea surface temperatures over the tropical east-central to eastern Pacific Ocean. However, forecasters estimate a shift to ENSO-neutral conditions is likely in the next month or so (an ~80% chance during May-July). ENSO-neutral conditions are then expected to continue at least through the Northern Hemisphere summer.
Hazardous Weather Events in April.
According to the Local Storm Reports issued by the local National Weather Service offices serving Florida, there were 449 individual local reports of hazardous weather events recorded across the state during the month of April (see Table 4 for a breakdown by event type). Severe weather swept through the southern U.S. on April 9-10, resulting in at least 3 fatalities, damaging buildings, and leaving thousands without power in Florida. NWS confirmed 4 tornadoes in the Panhandle during that weekend, along with high winds and quarter to just under golf ball-sized hail. A wildfire was reported in Homestead on the 30th with no immediate threats or endangerments.
Table 4. Breakdown of storm reports submitted in Florida during the month of April (compiled from Iowa State University/Iowa Environmental Mesonet).
| Report Type | Number of Reports |
| Coastal Flood | 1 |
| Flash Flood | 19 |
| Marine Thunderstorm Wind | 64 |
| Non-Thunderstorm Wind Gust | 46 |
| Tornado/Waterspout/Funnel Cloud | 5/6/2 |
| Thunderstorm Wind Damage | 70 |
| Thunderstorm Wind Gust | 148 |
| Hail | 82 |
| Heavy Rain | 5 |
| Wildfire | 1 |
Drought-Related Impacts.
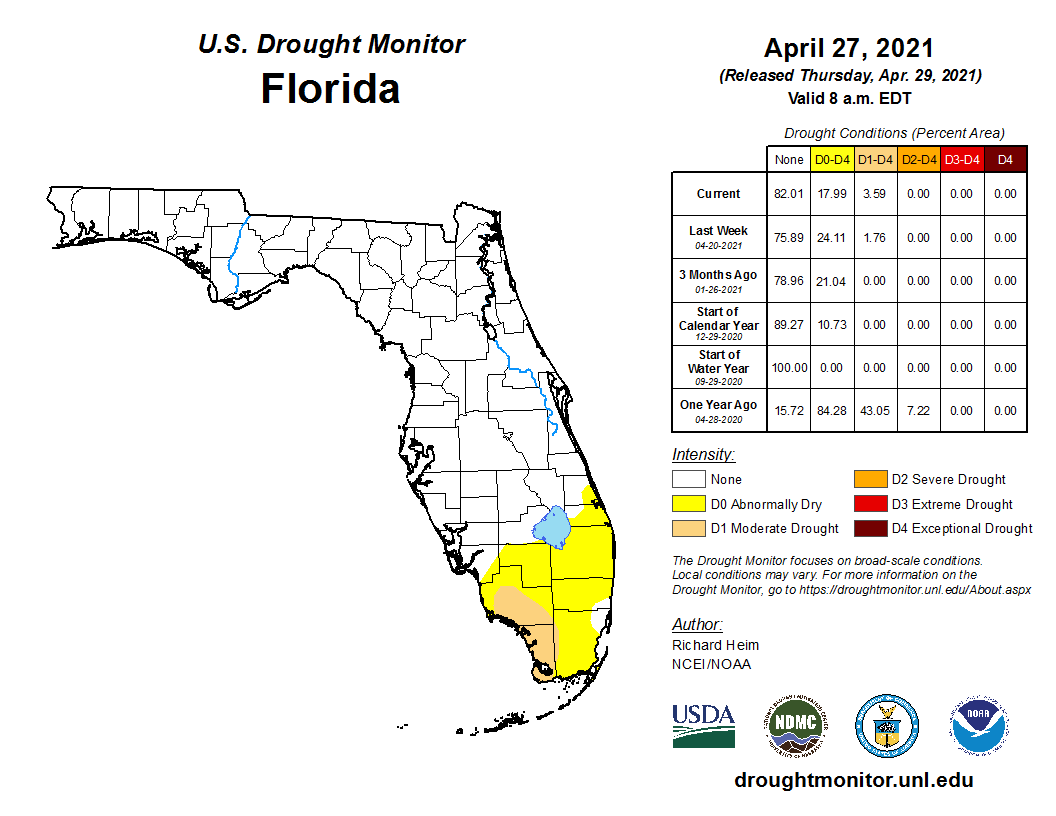
By the end of April 2021, abnormally dry conditions persisted across southern Florida. Moderate drought (D1) developed in southern Florida across Monroe County and parts of Collier and Miami-Dade counties. From early to mid-April, abnormally dry conditions existed across much of the Florida Peninsula. Moderate drought had developed across Monroe and Collier counties and stretching into Broward and Palm Beach counties. By the end of the month, however, moderate drought conditions were alleviated in Broward and Palm Beach counties. According to the U.S. Drought Monitor, 14 percent of the state was experiencing abnormally dry conditions (D0) and 4 percent was experiencing moderate drought (D1) by the end of the month.
As of April 30, the Lake Okeechobee water level was at 14.03 ft. above sea level (Feet-NGVD29), which is near to slightly above the average for this time of the year. At the first of the month, the water level was 14.44 ft. above sea level.
Agriculture-Related Impacts.
During mid-April, topsoil moisture levels were adequate for 67% of the state, short in 25%, and very short in 3%, while 5% of the state was in surplus. By the end of April, topsoil moisture levels were adequate in 57% of the state, short in 36%, and very short in 2% of the state; 5% of the state was in surplus. Most of the state had either fair (39%) or good (36%) pasture and range conditions by the end of the month. For more information, consult the weekly Crop Progress and Conditions report published by the USDA's National Agricultural Statistics Service.
Appendix 1
Additional April departures from normal data for select Florida locations (Source: NWS).
| Station | Average Temperature (˚F) | Departure from Normal (˚F) | Total Rainfall (in.) | Departure from Normal (in.) |
| Gainesville | 66.7 | -0.9 | 4.11 | +1.44 |
| Sarasota | 72.3 | +1.2 | 4.09 | +1.65 |
| Melbourne | 72.3 | +1.9 | 2.76 | +0.63 |
| Fort Myers | 75.3 | +1.5 | 3.73 | +1.55 |
| West Palm Beach | 76.4 | +2.6 | 2.88 | -0.78 |
Appendix 2
Select daily record high maximum temperatures tied or broken during April (compiled from NOAA).
| Location | Date | Record (˚F) | Broken/Tied | Last |
| Clermont | 1 | 93 | Broken | 92 in 2016 |
| Plant City | 1 | 93 | Broken | 92 in 1974 |
| Sanford | 1 | 91 | Tied | 91 in 1974 |
| Daytona Beach | 11 | 89 | Tied | 89 in 1935 |
| Crestview | 13 | 91 | Broken | 89 in 2001 |
| Tallahassee | 13 | 92 | Broken | 90 in 1981 |
| Miami | 17 | 90 | Tied | 90 in 2001 |
| Vero Beach | 17 | 91 | Broken | 90 in 2006 |
| Fort Lauderdale | 18 | 92 | Broken | 91 in 1924 |
| Fort Lauderdale Beach | 18 | 93 | Broken | 90 in 2001 |
| Vero Beach | 18 | 90 | Tied | 90 in 2006 |
| Miami | 19 | 92 | Tied | 92 in 1969 |
Appendix 3
Select daily record high minimum temperatures tied or broken during April (compiled from NOAA).
| Location | Date | Record (˚F) | Broken/Tied | Last |
| Sanford | 1 | 69 | Tied | 69 in 2002 |
| Mountain Lake | 12 | 77 | Broken | 73 in 2020 |
| Bradenton | 17 | 72 | Broken | 70 in 2015 |
| Venice | 17 | 74 | Broken | 73 in 1972 |
| Fort Myers | 17 | 72 | Broken | 71 in 1912 |
| Tampa | 17 | 75 | Broken | 74 in 1944 |
| Lakeland | 17 | 70 | Broken | 69 in 1994 |
| Bradenton | 18 | 74 | Broken | 70 in 2020 |
| Plant City | 18 | 73 | Tied | 73 in 2000 |
| Venice | 18 | 73 | Broken | 72 in 1978 |
| Punta Gorda | 19 | 76 | Broken | 71 in 1994 |
| Miles City | 19 | 72 | Broken | 68 in 2006 |
| Ochopee | 19 | 75 | Broken | 70 in 2019 |
| Fort Myers | 19 | 74 | Broken | 72 in 1982 |