
Prepared by Daniel J. Brouillette
Florida Climate Center
The Florida State University
Tallahassee, FL

Mean temperatures in September were above normal statewide. The anomalies in the northern and west-central parts of the state were the greatest (Table 1 and Appendix 1). Continuing a long-term trend, anomalies in monthly mean minimum temperature were more positive than anomalies in monthly mean maximum temperatures. September 2018 was the warmest on record at Gainesville, Daytona Beach, Tampa, Melbourne, and Key West, as well as other less major stations, and in the top five warmest on record at several other stations. Several high temperature records were tied or broken across the state (Appendix 2).
Table 1. September average temperatures and departures from normal (˚F) for selected cities.
| Station | Mean Temperature | Departure from Normal |
| Pensacola | 82.0 | +3.6 |
| Tallahassee | 82.7 | +4.5 |
| Jacksonville | 82.4 | +4.2 |
| Orlando | 83.4 | +2.3 |
| Tampa | 85.9 | +4.2 |
| Miami | 83.3 | +0.4 |
| Key West | 85.8 | +2.6 |
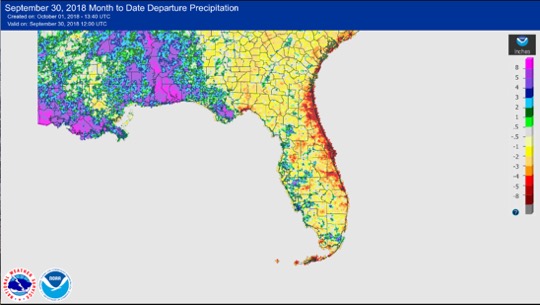
Rainfall totals in September were below normal except in the far southern part of the state, in the Tampa Bay area, and on much of the panhandle (Figure 1). The third-wettest September on record was registered at Pensacola, and Daytona Beach and Melbourne both had the second-driest September on record, with several other stations in the eastern half of the peninsula in the top 10 driest Septembers on record. Two 24-hour precipitation records were broken for the month (Table 3).
Table 2. September precipitation totals and departures from normal (inches) for selected cities.
| Station | Total Rainfall | Departure from Normal |
| Pensacola | 18.25 | +12.27 |
| Tallahassee | 4.07 | -0.62 |
| Jacksonville | 3.41 | -4.78 |
| Orlando | 1.91 | -4.15 |
| Tampa | 9.20 | +2.90 |
| Miami | 7.89 | -1.97 |
| Key West | 6.08 | -0.63 |
Table 3. Select daily rainfall records (inches) broken during September. (Compiled from NOAA, NWS)
| Date | Location | Record | Last |
| 5 | Pensacola | 5.98 | 1.77 in 1920 |
| 14 | Key West | 2.59 | 1.83 in 1997 |
Figure 1. A graphical depiction of the monthly rainfall departure from normal (inches) for September is given in the figure below (courtesy of NOAA, NWS).
ENSO-neutral conditions are present in the Pacific, with El Niño favored to develop.
Based on current data and forecast models, forecasters with the Climate Prediction Center (CPC) continue with an El Niño Watch. ENSO-neutral conditions currently are present, with sea-surface temperatures (SST) near to above average across the equatorial Pacific Ocean. The chance of El Niño development during the climatological boreal autumn (from now through the end of November) is rated at 50-55% (a decrease in probability from last month) and at 65-70% during the climatological boreal winter (December-January-February). The CPC seasonal outlook favors above-normal temperatures and above-normal precipitation over the northern two-thirds of the state and equal chances of above-, near-, and below-normal precipitation in the southern one-third through October 2018. For the balance of the climatological autumn as a whole (through the end of November), there is an enhanced probability of above-normal precipitation statewide, with above-normal temperatures favored in the southern half of the state and equal chances of above-, near-, and below-normal temperatures favored in the northern half.
Hazardous Weather Events in September.
According the Local Storm Reports (LSRs) issued by the local National Weather Service (NWS) offices serving Florida, 143 instances of hazardous weather were reported across the state in September 2018.
Table 4. Breakdown of storm reports submitted in Florida during the month of September. (Compiled from Iowa State University/Iowa Environmental Mesonet.)
| Report Type | Number of Reports |
| Storm Damage | 34 |
| High Winds | 54 |
| Dense Fog | 0 |
| Hail | 8 |
| Tornadoes/Funnel Clouds/Waterspouts | 21 |
| Heavy Rain | 2 |
| Fire | 0 |
| Flooding | 17 |
| Lightning | 3 |
| Heat | 0 |
| Coastal Hazards/Rip Currents | 4 |
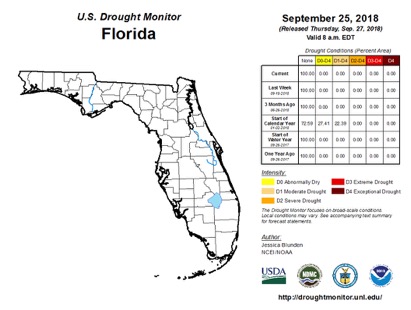
Drought-Related Impacts
At the end of September, according to the U.S. Drought Monitor, all of Florida was drought-free, continuing conditions that have been present since the late spring. Rainfall deficits that had accumulated on the far western panhandle were eliminated by heavy rains from Tropical Storm Dennis at the beginning of the month.
As of 1 October, the Lake Okeechobee water level was at 14.53 ft. above sea level, which is above average for this time of the year.
Agriculture-Related Impacts.
At the end of September, topsoil-moisture levels were mainly adequate, although about one-fifth of the state had very short or short topsoil-moisture levels and one-fifth had surplus moisture.
At the start of the month, Tropical Storm Gordon moved from just south of the Florida peninsula through the eastern Gulf of Mexico to a landfall point on the Mississippi coast. Heavy rainfall and strong winds were observed on the far western panhandle; agricultural impacts from this storm were fairly limited, although some cotton was reported blown down or twisted in Okaloosa County. Otherwise, the historically frequently wet conditions of summer gave way to drier conditions in most areas through the month, allowing for seasonal activities to progress with less hindrance. By month’s end, the peanut and hay harvest, slowed by wet conditions early in the month, was moving fast. As well, the harvest of avocado, bitter melon, boniato, malanga, and okra were underway. The planting of beans, bitter melon, boniato, carrots, leafy greens, malanga, okra, peppers, radishes, snap beans, sweet corn, and tomatoes was in progress.
Appendix 1
Additional September Departures from Normal Data for Florida Locations
| Station | Total rainfall (in.) | Departure from Normal (in.) | Average Temperature (˚F) | Departure from Normal (˚F) |
| Gainesville | 2.84 | -1.58 | 83.5 | +5.3 |
| Melbourne | 1.63 | -6.01 | 83.6 | +3.0 |
| Fort Lauderdale | 7.88 | -3.05 | 83.3 | +0.1 |
| Fort Myers | 4.95 | -3.36 | 83.1 | +0.7 |
Appendix 2
Select daily maximum and minimum temperature records (oF) tied or broken during September.
(Compiled from NOAA, NWS)
|
Date |
Station |
Type |
Value |
Broken/Tied |
Last |
|
15 |
Pensacola |
Max |
97 |
Broken |
95 in 1991 |
|
14 |
Gainesville |
Max |
96 |
Tied |
96 in 1952 |
|
15 |
Gainesville |
Max |
97 |
Broken |
96 in 1972 |
|
16 |
Gainesville |
High Min |
81* |
Broken |
79 in 2004 |
|
17 |
Gainesville |
High Min |
75 |
Tied |
75 in 1969 |
|
5 |
Orlando |
High Min |
77 |
Tied |
77 in 1932 |
|
18 |
Orlando |
High Min |
76 |
Tied |
76 in 2016 |
|
28 |
Orlando |
High Min |
77 |
Tied |
77 in 1903 |
|
5 |
Melbourne |
High Min |
81 |
Broken |
80 in 1991 |
|
15 |
Melbourne |
Max |
96 |
Broken |
94 in 1938 |
|
22 |
Melbourne |
High Min |
80 |
Tied |
80 in 2009 |
|
29 |
Melbourne |
High Min |
82 |
Broken |
80 in 1989 |
|
30 |
Melbourne |
High Min |
81 |
Broken |
78 in 2007 |
|
12 |
Tampa |
Max |
95 |
Broken |
94 in 2008 |
|
15 |
Tampa |
High Min |
83 |
Broken |
80 in 2016 |
|
16 |
Tampa |
High Min |
84** |
Broken |
80 in 1933 |
|
17 |
Tampa |
High Min |
82 |
Broken |
80 in 1996 |
|
20 |
Tampa |
Max |
96 |
Broken |
94 in 2017 |
|
24 |
Tampa |
Max |
95 |
Broken |
94 in 1930 |
|
26 |
Tampa |
Max |
95 |
Broken |
94 in 1986 |
|
29 |
Tampa |
Max |
97 |
Broken |
93 in 2002 |
|
30 |
Tampa |
Max |
97*** |
Broken |
93 in 2005 |
|
3 |
Miami |
High Min |
81 |
Tied |
81 in 1945 |
|
17 |
Miami |
High Min |
81 |
Tied |
81 in 1988 |
|
27 |
Miami |
High Min |
82 |
Broken |
81 in 1989 |
|
25 |
Fort Lauderdale |
High Min |
81 |
Broken |
80 in 2017 |
|
26 |
Fort Lauderdale |
High Min |
82 |
Tied |
82 in 1998 |
*This value breaks the all-time highest minimum temperature ever recorded at Gainesville for the month of September (records back to 1890), last set on 16 September 2004.
**This value breaks the all-time highest minimum temperature ever recorded at Tampa for the month of September (records back to 1890), last set on 15 September 2018 and before that on 11 September 2015.
***This value breaks the all-time highest maximum temperature ever recorded at Tampa for the month of September (records back to 1890), last set on 29 September 2018 and before that on 20 September 2018 and 7 September 1991.