Prepared by Lydia Stefanova, Daniel J. Brouillette, and David F. Zierden.
Florida Climate Center
The Florida State University
Tallahassee, FL

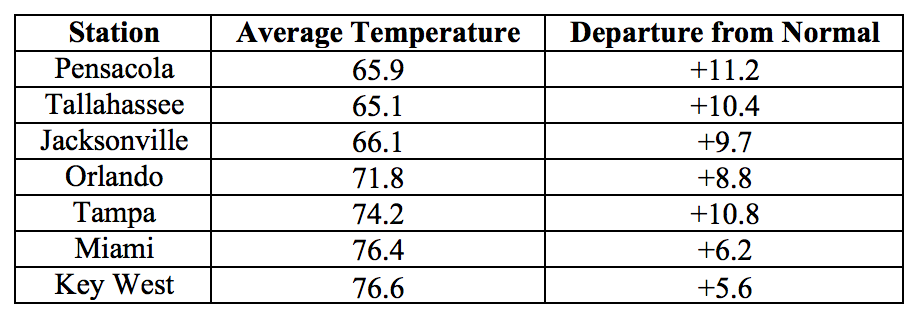
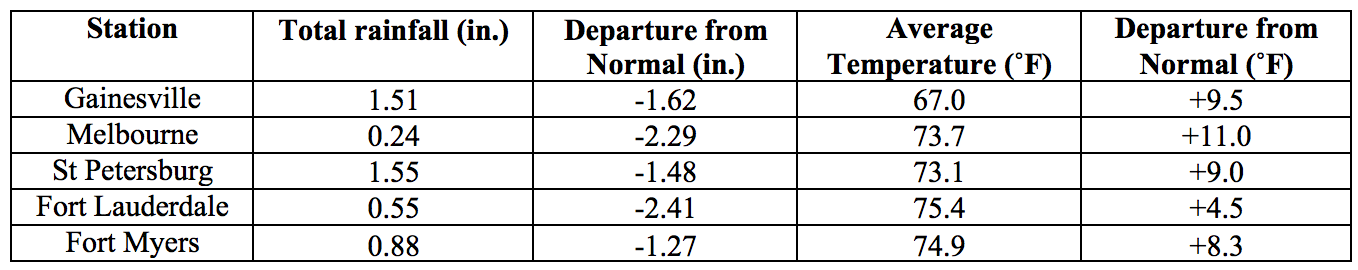
Average temperatures in February were significantly above normal across the state. The departures from average temperatures in February 2018 were significantly above normal across the entire state, ranging from +4.5˚F in Fort Lauderdale to +11.2˚F in Pensacola (Table 1 and Appendix 1). February 2018 was the warmest February on record for a large number of long-term reporting stations, including Pensacola, Tampa, St. Petersburg, Orlando, Melbourne, Fort Myers, West Palm Beach, and Miami. At many of these stations the monthly mean temperature for February 2018 was 2 or even 3˚F warmer than the previously standing record. It was the second warmest February on record for Tallahassee, Jacksonville, Gainesville, and Key West. According to preliminary analysis, this was the warmest February for the state as a whole. A number of daily warm temperature records were tied or broken across the state (Appendix 2).
Table 1: February average temperatures and departures from normal (˚F) for selected cities.
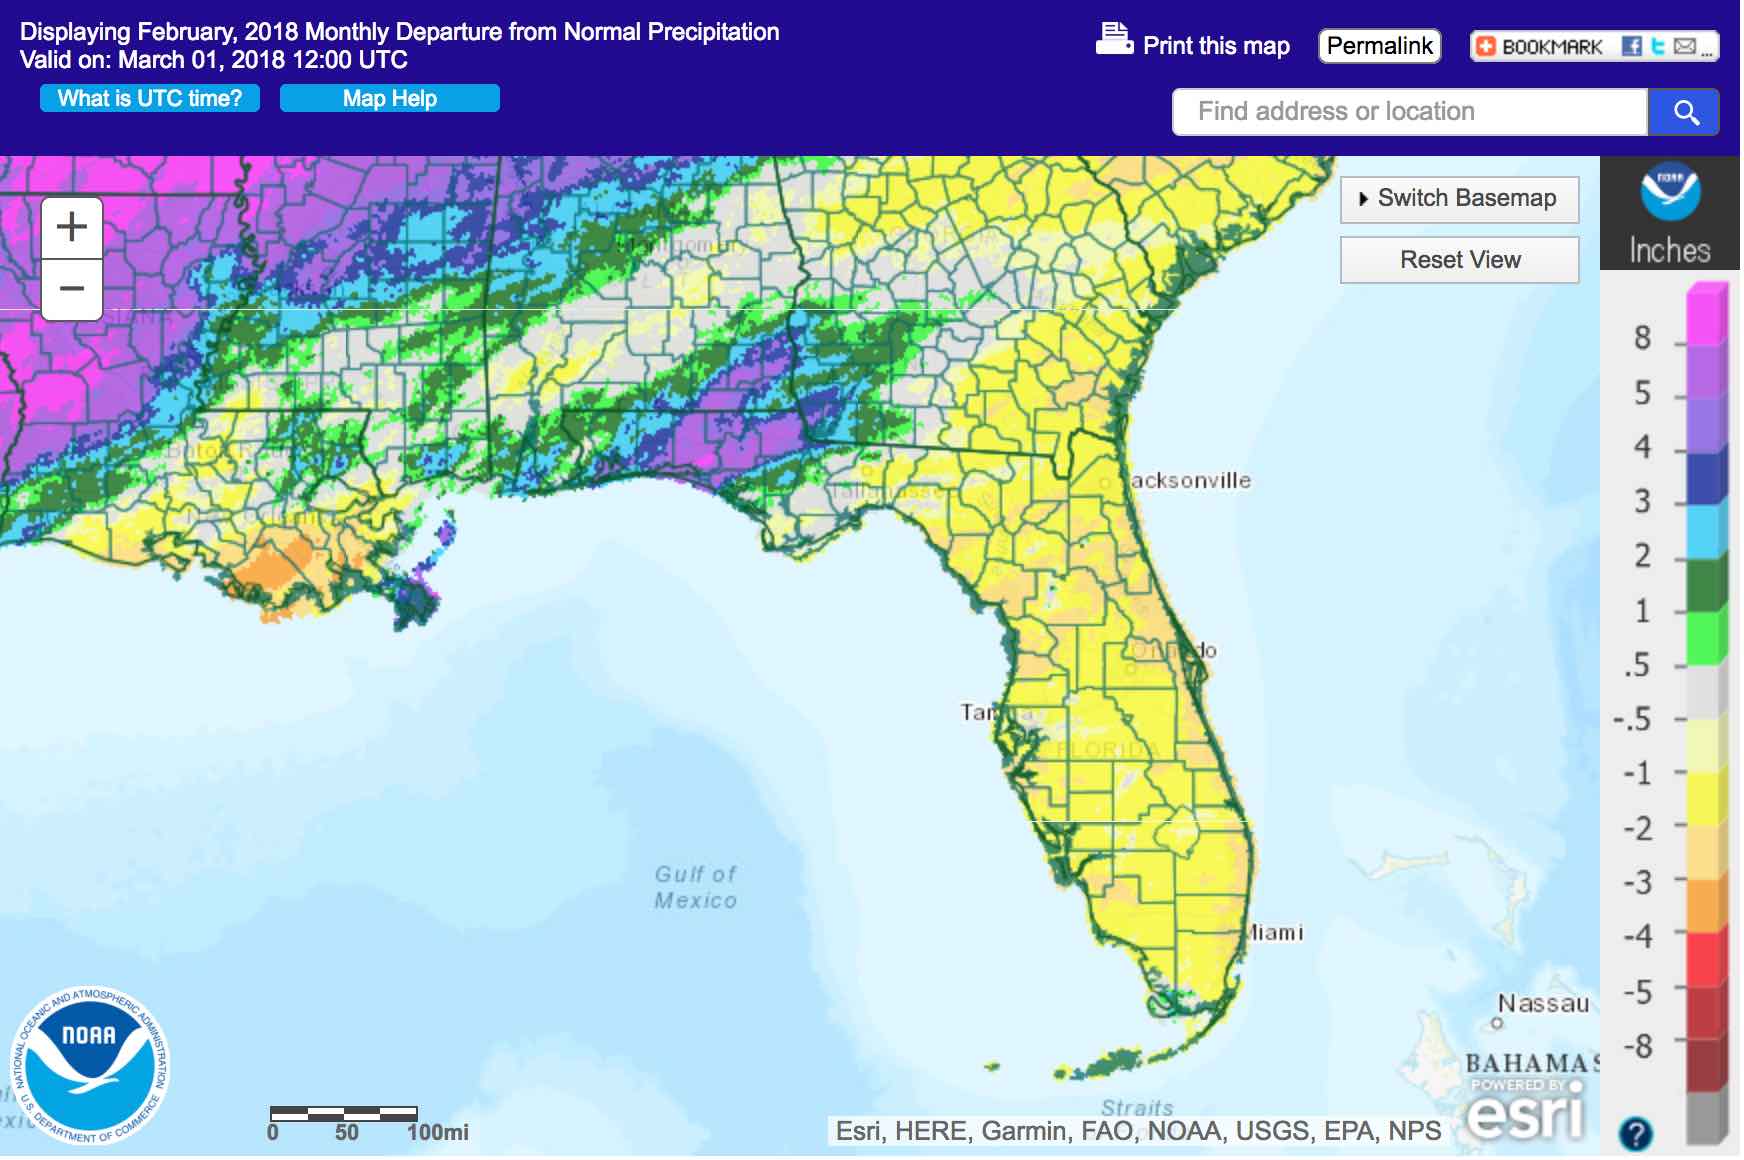
Rainfall totals in February were mixed. Rainfall totals in February 2018 were below normal for the Peninsula and the eastern Panhandle, and above normal in the western Panhandle (Figure 1). Departures from normal roughly ranged from +5.12” in Pensacola to -2.41” in Fort Lauderdale (Table 2 and Appendix 1), although localized parts of the state saw rainfall totals that were as much as 3.00” below normal to 8.00” above normal (Figure 1). One 24-hour precipitation record was broken for the month (Table 3).
Table 2: February precipitation totals and departures from normal (inches) for select cities.
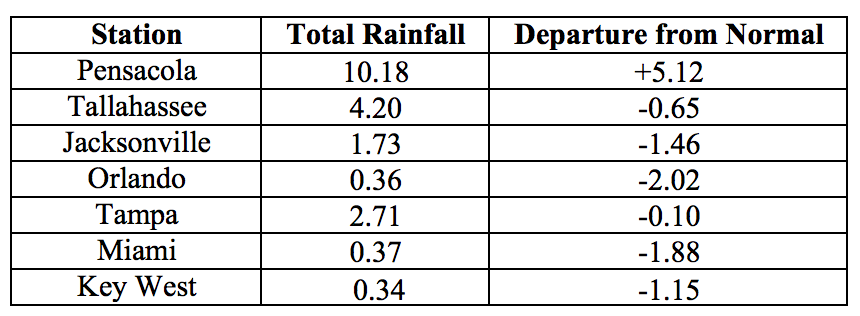
Table 3: Select daily rainfall records (inches) broken during February. (Compiled from NOAA, NWS).
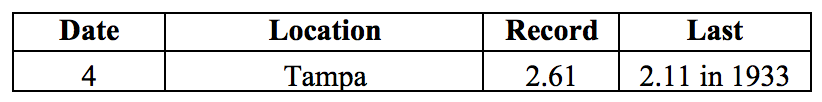
Figure 1: A graphical depiction of the monthly rainfall departure from normal (inches) for February is given in the figure below (courtesy of NOAA, NWS)
La Niña Conditions are Present in the Pacific.
Based on current data and forecast models, the Climate Prediction Center (CPC) ENSO Alert System is still set to a La Niña Advisory. La Niña conditions are currently present, with sea surface temperatures (SST) below average across the central and eastern equatorial Pacific Ocean. Based on forecast model predictions, a transition to ENSO-neutral conditions is favored during the spring of 2018. The CPC seasonal outlook favors above-normal temperatures and below-normal precipitation through May 2018.
Hazardous Weather Events in February.
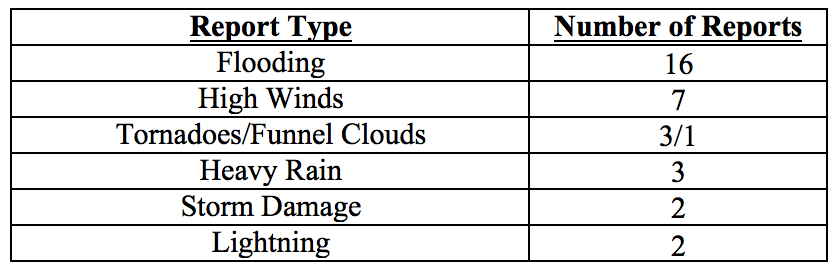
In terms of hazardous weather, February 2018 was a relatively quiet month, with only 34 entries in the Local Storm Reports Database maintained by the National Weather Service (see Table 4). The majority of these involved flooding in the western Panhandle following heavy rains from a passing cold front on the 11th. Several roads in Walton, Holmes, and Washington Counties were closed due to flooding. Two tornadoes were associated with this weather system – an EF1 tornado in Holmes County that destroyed two barns, a carport, and a roof of a house, and caused one minor injury, and an F0 tornado in Jackson County that downed some trees and caused minor building damage.
Table 4: Breakdown of storm reports submitted in Florida during the month of February (Compiled from Iowa State University/Iowa Environmental Mesonet.)
Drought-Related Impacts.
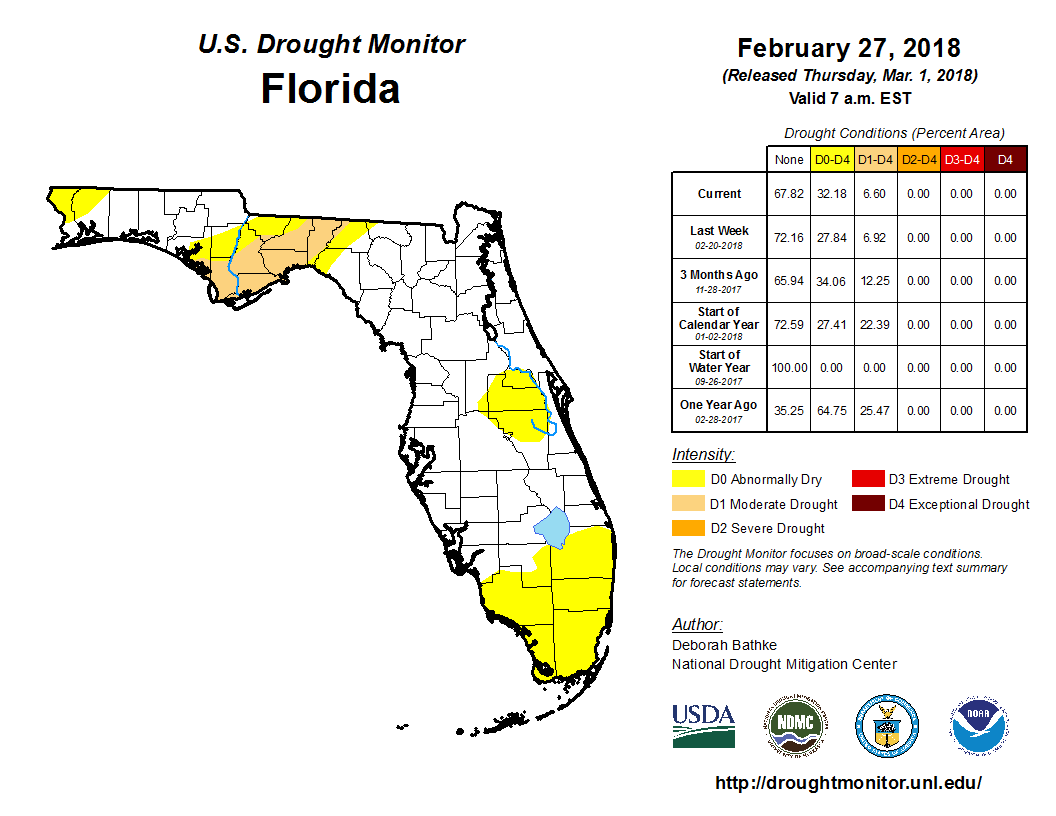
At the end of January, approximately 74% of the state, including the entire Peninsula, was drought free. Most of the remaining 26%, from the western edge of the state to the Big Bend, were experiencing severe drought (D2) conditions. By the first week of the month conditions over the Panhandle started to improve, and by the second week of the areas of severe drought had converted to either a moderate drought (D1) or abnormally dry (D0) state. As the month progressed, D0 conditions took residence in parts of Central and most of South Florida, while large portions of the western Panhandle became drought-free. As of the latest U. S. Drought Monitor report, approximately a quarter of the state is abnormally dry, and less than one-tenth of the state (including Gulf, Franklin, Liberty, Wakulla, Leon, and Jefferson Counties) is experiencing moderate drought. The remainder of the state is drought-free. Lake Okeechobee water levels at the end of the month were at 14.86 ft., which is less than half a foot above normal for this time of the year.
Figure 2: Latest U. S. Drought Monitor Map for Florida (from http://droughtmonitor.unl.edu/)
Agriculture-Related Impacts.
At the end of January, topsoil moisture levels across the state were at mainly adequate (58% of soils) or short (33%), although some (7%) very short values were also reported. During February these values shifted somewhat towards the drier end, with 48% adequate, 29% short, and 11% very short. For the first time since summer 2017 parts of the citrus growing region have begun experiencing abnormally dry conditions. Because of the unseasonably warm temperatures and relatively low rainfall, most citrus groves, even those in drought free areas, have required regular irrigation. Early blossoms have been reported on some citrus varieties. Pastures in most of the Panhandle have not adequately recovered after the earlier severe and moderate drought and insufficient rainfall, although some improvement was seen in Levy and Washington Counties. There were reports of fertilizer washed away from pastures in Jackson County by heavy rain. Cattle across the state remain in mostly good to fair condition, and most producers are using supplemental feed. A wide variety of fruit and vegetable crops were being harvested across the state, and watermelon planting is underway. Some increase in vegetable disease pressure has been seen following unseasonably warm temperatures and foggy mornings in the southern part of the state. Sugarcane harvesting and fertilizing is ongoing in Broward, Glades, Hendry, and Palm Beach Counties. Corn planting is beginning in Lafayette County
Appendix 1: Additional February departures from normal data for Florida locations.
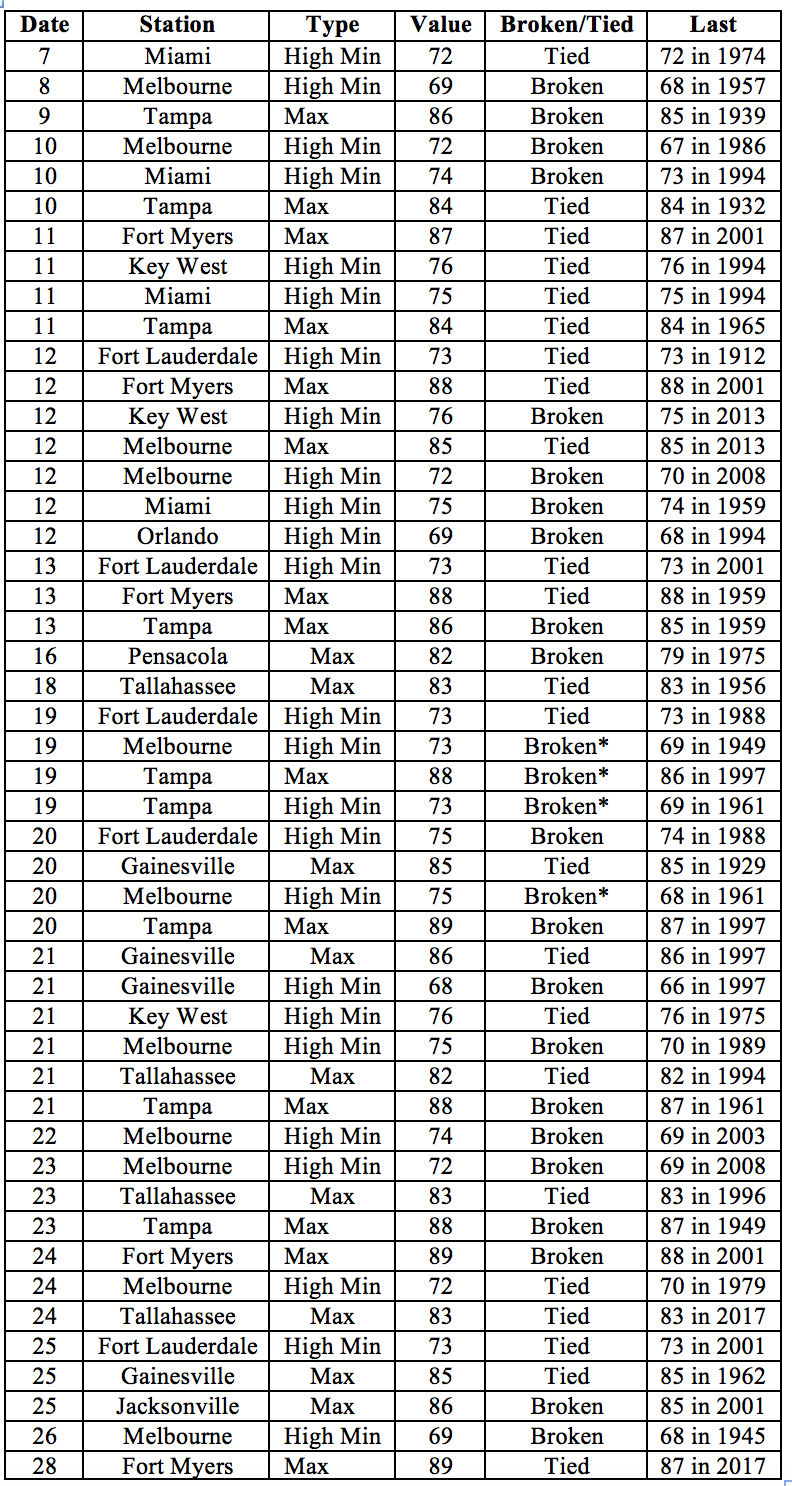
Appendix 2: Select daily maximum and minimum temperature records (° F) broken or tied during February (compiled from NOAA, NWS). Asterisk indicates an all-time record for any day in February.